Overview
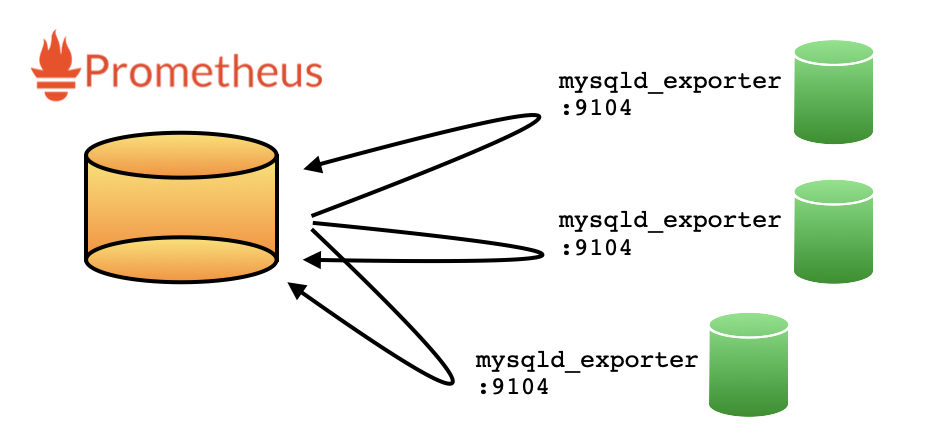
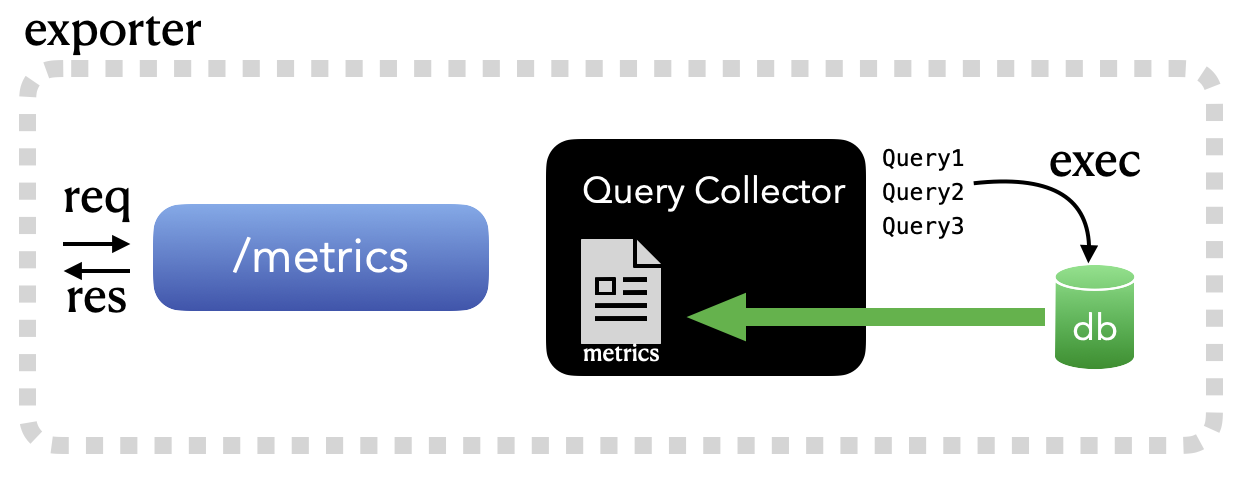
세상에는 수많은 모니터링 도구들이 있습니다. 최근 많이 사용하고 있는 시계열 데이터베이스인 Prometheus와 수많은 exporter가 그중 하나입죠. 매트릭 수집에 최적화된 이런 구성은 시스템의 상태 값을 수집하기에는 더없이 좋은 시스템이기는 합니다만, 로그성 데이터 수집(에러로그 혹은 syslog)에는 아무래도 한계를 가집니다.
이 경우, td-agent와 같은 범용적인 로그 수집 에이전트를 활용하게 되는데요. (혹은 자체적으로 구현을 하거나) 타팀과 혼재해서 사용하는 경우 문제 발생소지가 있긴합니다. 참고로, td-agent는 ruby 뿐만 아니라, 필요한 라이브러리들을 패키지 내부에 포함시켜서, OS 의존성을 최소화합니다.
오늘 포스팅에서는 td-agent와 같이 fluentd를 패키징하는 방법에 대해서 이야기를 해보도록 하겠습니다.
Packaging environment
이제부터 이야기할 내용은 기본적으로 CentOS7 기반을 전제로 합니다. 참고로, CentOS6 경우에는 EOL 여파인지 모르지만.. YUM 레파지토리 관리 뿐만 아니라.. 소소한 몇몇 문제가 있어서. 조금 귀찮아지더라고요. 🙂
패키징 환경을 구성하기 위한 방안은 Docker를 이용해보는 방법과 Vagrant를 활용하여 빠르게 OS이미지를 받아오는 방법이죠.
1. Docker
Docker가 정상적으로 구성이 되어 있는 환경에서, 아래와 같이 간단하게 CentOS7 환경을 만들어보겠습니다. 만약 centos:7 이미지가 없으면, 자동으로 이미지를 받아와서 컨테이너를 잘 만들어줍니다.
$ docker run -d -it --name=pkg-dev centos:7 bash
$ docker exec -it pkg-dev bash
[root@f02a337793f9 /]# yum -y install net-tools sysstat telnet bash wget openssl md5 tar bzip2 patch gcc git autoconf openssl-devel
2. Vagrant
VirtualBox를 쓸 수 있는 환경이라면, Vargrant도 좋은 대안이기도 합니다. 여기서는 맥북 환경 기준으로 vagrant 구성해보도록 하겠습니다.
## Install vagrant with brew
$ brew install cask
$ brew install --cask virtualbox
$ brew install --cask vagrant
$ brew install --cask vagrant-manager

$ echo 'export PATH=$PATH:/opt/vagrant/bin:.' >> ~/.zshrc
$ . ~/.zshrc

$ mkdir -p ~/Document/vagrant/centos7-node01
$ cd ~/Document/vagrant/centos7-node01

## Vagrant file
$ echo "
Vagrant.configure('2') do |config|
  config.vm.box = 'centos/7'
  # config.vm.network "private_network", ip: "192.168.56.60"
  config.vm.provider 'virtualbox' do |vb|
    vb.gui = true
    vb.memory = '2048'
    vb.customize ['modifyvm', :id, '--audio', 'none']
  end
  config.vm.provision 'shell', inline: <<-SHELL
    yum update -y
    yum -y install net-tools sysstat telnet bash wget openssl md5 tar bzip2 patch gcc git autoconf openssl-devel
    echo 'test12' | passwd --stdin root
    sed -i 's/PasswordAuthentication no/PasswordAuthentication yes/g' /etc/ssh/sshd_config
    /sbin/service sshd restart
  SHELL
end" > Vagrantfile

vagrant up
참고로, 위 Vagrant 파일은 2G 메모리(vb.memory = ‘2048’)와 사용전 필요할만한 것들은 이것저것(?) 설치를 하고, root 패스워드를 'test12'로 구성하는 설정입니다. 만약 내부네트워크를 구성하고 싶다면, 위 설정에서 주석을 풀고 아이피를 적당하게 변경하시고 vagrant up 을 수행하면 됩니다.
이것 외에도 사실.. KVM을 활용한 리눅스 자체에서 Virtual machine을 생성하는 방법도 있지만, 이건 스킵! 🙂
이제 나만의 패키징을 위한 OS 세팅은 완료되었으니, 이제부터 제대로 시작을 해보도록 하겠습니다.
Ruby packaging
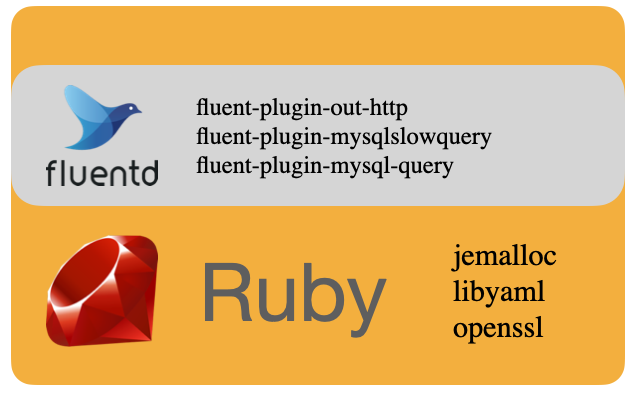
Fluentd는 기본적으로 ruby 위에서 구동되는 프로그램입니다. 그리고 최종적인 목표는 아래 그림과 같이, 패키징한 루비 위에, fluentd를 구성하고, 기타 필요한 fluentd 전용 플러그인을 설치하는 것입니다.
첫번째 단계로 우선 Ruby를 특정 디렉토리 안에 패키징을 해보죠. 이것을 위해 ruby-install 이라는 유틸리티를 사용토록 하겠습니다.
https://github.com/postmodern/ruby-install
########################
## Disable ssl
########################
$ echo "sslverify=false" >> /etc/yum.conf"
$ yum -y install make

########################
# ruby-install
########################
$ export V_RUBY_INSTALL="0.8.2"
$ wget -O ruby-install-${V_RUBY_INSTALL}.tar.gz https://github.com/postmodern/ruby-install/archive/v${V_RUBY_INSTALL}.tar.gz
$ tar -xzvf ruby-install-${V_RUBY_INSTALL}.tar.gz
$ cd ruby-install-${V_RUBY_INSTALL}/
$ make install

########################
# embeded-ruby
########################
$ export V_RUBY="2.7.4"
$ export LD_LIBRARY_PATH=/opt/my-agent/lib
$ export PATH=$PATH:/opt/my-agent/bin
$ ruby-install --install-dir /opt/my-agent ruby ${V_RUBY} -- --enable-shared CPPFLAGS=-I/opt/my-agent/include LDFLAGS=-L/opt/my-agent/lib
이 과정을 거치고나면, /opt/my-agent 하단에 하단 같은 모습으로 구성되어 있는 것을 확인해볼 수 있습니다.
$ ls -al /opt/my-agent
total 24
drwxr-xr-x 6 root root 4096 Sep  2 08:06 .
drwxr-xr-x 1 root root 4096 Sep  2 08:06 ..
drwxr-xr-x 2 root root 4096 Sep  2 08:06 bin
drwxr-xr-x 3 root root 4096 Sep  2 08:06 include
drwxr-xr-x 3 root root 4096 Sep  2 08:06 lib
drwxr-xr-x 5 root root 4096 Sep  2 08:06 share
이제 fluentd 패키징을 위한 Ruby 환경 구성은 마무리되었습니다.
Install fluentd
Ruby가 패키징이 잘 이루어졌으니. 이제 fluentd를 루비 환경에 잘 넣어보도록 하겠습니다.
## fluentd
$ cd /opt/my-agent
$ ./bin/gem install fluentd
$ ./bin/fluentd -s conf
Installed conf/fluent.conf.

$ ls -al
total 28
drwxr-xr-x 7 root root 4096 Sep  2 09:04 .
drwxr-xr-x 1 root root 4096 Sep  2 08:06 ..
drwxr-xr-x 2 root root 4096 Sep  2 09:03 bin
drwxr-xr-x 3 root root 4096 Sep  2 09:04 conf
drwxr-xr-x 3 root root 4096 Sep  2 08:06 include
drwxr-xr-x 3 root root 4096 Sep  2 08:06 lib
drwxr-xr-x 5 root root 4096 Sep  2 08:06 share
이제 각각 필요할만한 라이브러리들을 컴파일하면서 /opt/my-agent/lib에 넣어보도록 해보죠. jemalloc, libyaml, openssl이 없을수도 있을만한 환경을 위해서, 아래와 같이 각각 컴파일을 해서 진행합니다. 그리고, mysql을 직접적으로 접근할 수도 있기에, mysql client 관련 라이브러리도 하단과 같이 잘 포함시켜 줍니다.
## jemalloc
$ cd ${HOME}
$ git clone https://github.com/jemalloc/jemalloc.git
$ cd jemalloc
$ ./autogen.sh --prefix=/opt/my-agent
$ make && make install

## libyaml
$ cd ${HOME}
$ export V_LIB_YAML="0.2.5"
$ wget --no-check-certificate http://pyyaml.org/download/libyaml/yaml-${V_LIB_YAML}.tar.gz
$ tar xzvf yaml-${V_LIB_YAML}.tar.gz
$ cd yaml-${V_LIB_YAML}
$ ./configure --prefix /opt/my-agent
$ make && make install

## openssl
$ cd ${HOME}
$ export V_OPENSSL="1.1.1"
$ wget https://www.openssl.org/source/old/${V_OPENSSL}/openssl-${V_OPENSSL}.tar.gz
$ tar xzvf openssl-${V_OPENSSL}.tar.gz
$ cd openssl-${V_OPENSSL}
$ ./config --prefix=/opt/my-agent
$ make && make install

## mysql client
$ cd ${HOME}
$ yum -y install mysql-devel mysql-libs
$ cp -R /usr/lib64/mysql/libmysqlclient* /opt/my-agent/lib/
$ mkdir -p /opt/my-agent/include
$ cp -R /usr/include/mysql /opt/my-agent/include/
자! 이제 기본적인 fluentd 패키징은 완료하였습니다. 이제부터는 필요한 플러그인들을 설치할 단계입니다.
Install fluentd plugins
제 입장에서는 사용해볼만한 플로그인은 크게 아래 세가지로 꼽아볼 수 있을 듯 하네요.
$ cd /opt/my-agent/bin
$ ./gem install fluent-plugin-out-http
$ ./gem install fluent-plugin-mysqlslowquery
$ ./gem install fluent-plugin-mysql-query
각 플러그인에 간단하게 설명을 해보죠.
3.1. fluent-plugin-out-http
source로부터 전달받은 내용을 특정 HTTP API로 전달하는 플러그인으로, 저는 개인적으로 에러로그 수집에 활용을 해보고 있습니다. 에러로그 수집을 위한 샘플입니다. 참고로, http://192.168.56.101:5000/errorlog 수집 API 는 별도로 구현을 해야하는 것은 아시죠? (기회가 된다면, 이것도 한번. 코드로 공유를. ㅎㅎ)
<source>
  @type tail
  path /data/mysql/*.err
  pos_file /opt/my-agent/log/mysql.error.pos
  tag mysql.error
  format none
</source>

<filter mysql.error>
  @type record_transformer
  enable_ruby
  <record>
    hostname ${hostname}
    timestamp ${time.to_i}
  </record>
</filter>

<match mysql.error>
  @type http
  buffer_type file
  buffer_path /opt/my-agent/log/mysql.error.*.buffer
  flush_interval 1s
  endpoint_url   http://192.168.56.101:5000/errorlog
  http_method    post
  #serializer     json
  #bulk_request   true
</match>
v1.2.2에서는 라인단위로 명시된 endpoint_url을 매번 호출하는 형태로 구현이 되어 있었습니다.
# bulk_request: false
error line1 ========> API call
error line2 ========> API call
error line3 ========> API call
error line4 ========> API call
error line5 ========> API call

# bulk_request: true
error line1
error line2
error line3
error line4
error line5 ========> API call (line1~line5)
일반적인 상황에서는 큰 문제가 되지 않지만, 몇천 라인의 에러로그가 순식간에 생성이 되었을 때.. 수집 효율이 굉장히 떨어질 수 밖에 없겠죠. 현 버전에서는 bulk_request옵션이 추가되면서, 대략 1MB 미만(600K~800K)으로 데이터를 끊어서 application/x-ndjson로 묶어서 API를 호출합니다. (한번에 전달받은 메시지를 묶어서 디비 insert 처리를 하니, 만건 로그도 큰 무리없이 한번에 잘 넣긴 하네요. ㅎ)
옵션에 대한 추가 내용은 하단 깃을 읽어보시고, 필요한 것들을 잘 사용해보면 좋겠네요. ^^
https://github.com/fluent-plugins-nursery/fluent-plugin-out-http
3.2. fluent-plugin-mysqlslowquery
MySQL 슬로우 쿼리 수집을 위한 플러그인으로.. 슬로우 로그 위치를 지정해놓으면, 잘 파싱해서 전달해줍니다. 아래는 샘플 설정입니다.
<source>
  @type mysql_slow_query
  path /var/lib/mysql/mysql-slow.log
  tag mysql.slow
  <parse>
    @type none
  </parse>
</source>

<match mysql.slow>
  @type http
  buffer_type file
  buffer_path /opt/uldra-agent/log/mysql.slow.*.buffer
  flush_interval 1s
  endpoint_url    http://192.168.56.101:5000/slowlog
  serializer      json
  bulk_request    true
  http_method     post
</match>
사실 이 플러그인이 편리하기는 하지만.. 문제는 한번에 다량의 슬로우 쿼리가 발생했을 시.. 이 플러그인에서 무한정 리소스를 먹기 때문에.. 개인적으로는 활용하고 있지는 않습니다. 이렇게 활용할 바에는 차라리, 앞선 에러로그 수집과 같은 방식으로 tail로 소스를 받아서 병합을 API 서버 레벨에서 해주는 것이 훨씬 안정적이고 유리할 듯 하네요. ^^
그리고, 아쉽게도. 이 프로젝트는 더이상 개발이 되지 않는듯한? (혹은 다른 어디선가 새롭게? ㅎㅎ)
https://github.com/yuku/fluent-plugin-mysqlslowquery
3.3. fluent-plugin-mysql-query
MySQL에 쿼리를 날려서 데이터를 추출하는 플러그인 입니다. fluentd로 주기적으로 데이터베이스로부터 데이터를 추출해서 결과를 타겟으로 던질 때 좋을만한 플러그인입니다.
<source>
  @type           mysql_query
  host            127.0.0.1
  port            3306
  username        fluentd
  password        fluentd123
  interval        30s
  tag             mysql-query-01
  query           select 'chan' j, now() t;
  record_hostname yes
  nest_result     yes                 # Optional (default: no)
  nest_key        data                # Optional (default: result)
  row_count       yes                 # Optional (default: no)
  row_count_key   row_count           # Optional (default: row_count)
</source>

<match mysql-query-01>
  @type http
  buffer_type file
  buffer_path /opt/db-agent/log/mysql.query01.*.buffer
  flush_interval 1s
  endpoint_url    http://192.168.56.101:5000/query
  http_method     post
  serializer      json
  bulk_request    true
  http_method     post
</match>
개인적으로는 사용하고 있지는 않지만.. 향후 필요한 경우 요긴하게 활용하기 위해 저는 기본적으로 넣어놓습니다.
https://github.com/y-ken/fluent-plugin-mysql-query
Startup script
td-agent의 init.d 스크립트를 약간의 변경(?)을 주어서 구성해보았습니다. 중간 부분을 보게되면, jemalloc으로 프로그램을 구동하는 것을 확인할 수 있습니다.
#!/bin/sh
### BEGIN INIT INFO
# Provides:          my-agent
# Required-Start:    $network $local_fs
# Required-Stop:     $network $local_fs
# Default-Start:     2 3 4 5
# Default-Stop:      0 1 6
# Short-Description: data collector for Treasure Data
# Description:       my-agent is a data collector
### END INIT INFO
# pidfile:           /opt/my-agent/my-agent.pid

export PATH=/sbin:/opt/my-agent/sbin:/bin:/usr/bin

MY_AGENT_NAME=my-agent
MY_AGENT_HOME=/opt/my-agent
MY_AGENT_DEFAULT=/etc/sysconfig/my-agent
MY_AGENT_USER=root
MY_AGENT_GROUP=root
MY_AGENT_RUBY=${MY_AGENT_HOME}/bin/ruby
MY_AGENT_BIN_FILE=${MY_AGENT_HOME}/sbin/my-agent
MY_AGENT_LOG_FILE=${MY_AGENT_HOME}/log/my-agent.log
MY_AGENT_PID_FILE=${MY_AGENT_HOME}/my-agent.pid
MY_AGENT_LOCK_FILE=/var/lock/subsys/my-agent
MY_AGENT_OPTIONS="--use-v1-config"

# timeout can be overridden from /etc/sysconfig/my-agent
STOPTIMEOUT=120

# Read configuration variable file if it is present
if [ -f "${MY_AGENT_DEFAULT}" ]; then
  . "${MY_AGENT_DEFAULT}"
fi

# Arguments to run the daemon with
MY_AGENT_ARGS="${MY_AGENT_ARGS:-${MY_AGENT_BIN_FILE} --log ${MY_AGENT_LOG_FILE} ${MY_AGENT_OPTIONS}}"
START_STOP_DAEMON_ARGS="${START_STOP_DAEMON_ARGS}"

# Exit if the package is not installed
[ -x "${MY_AGENT_RUBY}" ] || exit 0

# Source function library.
. /etc/init.d/functions

# Define LSB log_* functions.
lsb_functions="/lib/lsb/init-functions"
if test -f $lsb_functions ; then
  . $lsb_functions
else
  log_success_msg()
  {
    echo " SUCCESS! $@"
  }
  log_failure_msg()
  {
    echo " ERROR! $@"
  }
  log_warning_msg()
  {
    echo " WARNING! $@"
  }
fi

# Check the user
if [ -n "${MY_AGENT_USER}" ]; then
  if ! getent passwd | grep -q "^${MY_AGENT_USER}:"; then
    echo "$0: user for running ${MY_AGENT_NAME} doesn't exist: ${MY_AGENT_USER}" >&2
    exit 1
  fi
  mkdir -p "$(dirname "${MY_AGENT_PID_FILE}")"
  chown -R "${MY_AGENT_USER}" "$(dirname "${MY_AGENT_PID_FILE}")"
  START_STOP_DAEMON_ARGS="${START_STOP_DAEMON_ARGS} --user ${MY_AGENT_USER}"
fi

if [ -n "${MY_AGENT_GROUP}" ]; then
  if ! getent group -s files | grep -q "^${MY_AGENT_GROUP}:"; then
    echo "$0: group for running ${MY_AGENT_NAME} doesn't exist: ${MY_AGENT_GROUP}" >&2
    exit 1
  fi
  MY_AGENT_ARGS="${MY_AGENT_ARGS} --group ${MY_AGENT_GROUP}"
fi

if [ -n "${MY_AGENT_PID_FILE}" ]; then
  mkdir -p "$(dirname "${MY_AGENT_PID_FILE}")"
  chown -R "${MY_AGENT_USER}" "$(dirname "${MY_AGENT_PID_FILE}")"
  MY_AGENT_ARGS="${MY_AGENT_ARGS} --daemon ${MY_AGENT_PID_FILE}"
fi

# 2012/04/17 Kazuki Ohta <k@treasure-data.com>
# Use jemalloc to avoid memory fragmentation
if [ -f "${MY_AGENT_HOME}/lib/libjemalloc.so" ]; then
  export LD_PRELOAD="${MY_AGENT_HOME}/lib/libjemalloc.so"
fi

kill_by_file() {
  local sig="$1"
  shift 1
  local pid="$(cat "$@" 2>/dev/null || true)"
  if [ -n "${pid}" ]; then
    if /bin/kill "${sig}" "${pid}" 1>/dev/null 2>&1; then
      return 0
    else
      return 2
    fi
  else
    return 1
  fi
}

#
# Function that starts the daemon/service
#
do_start() {
  # Set Max number of file descriptors for the safety sake
  # see http://docs.fluentd.org/en/articles/before-install
  ulimit -n 65536 1>/dev/null 2>&1 || true
  local RETVAL=0
  daemon --pidfile="${MY_AGENT_PID_FILE}" ${START_STOP_DAEMON_ARGS} "${MY_AGENT_RUBY}" ${MY_AGENT_ARGS} || RETVAL="$?"
  [ $RETVAL -eq 0 ] && touch "${MY_AGENT_LOCK_FILE}"
  return $RETVAL
}

#
# Function that stops the daemon/service
#
do_stop() {
  # Return
  #   0 if daemon has been stopped
  #   1 if daemon was already stopped
  #   2 if daemon could not be stopped
  #   other if a failure occurred
  if [ -e "${MY_AGENT_PID_FILE}" ]; then
    # Use own process termination instead of killproc because killproc can't wait SIGTERM
    if kill_by_file -TERM "${MY_AGENT_PID_FILE}"; then
      local i
      for i in $(seq "${STOPTIMEOUT}"); do
        if kill_by_file -0 "${MY_AGENT_PID_FILE}"; then
          sleep 1
        else
          break
        fi
      done
      if kill_by_file -0 "${MY_AGENT_PID_FILE}"; then
        echo -n "Timeout error occurred trying to stop ${MY_AGENT_NAME}..."
        return 2
      else
        rm -f "${MY_AGENT_PID_FILE}"
        rm -f "${MY_AGENT_LOCK_FILE}"
      fi
    else
      return 1
    fi
  else
    if killproc "${MY_AGENT_PROG_NAME:-${MY_AGENT_NAME}}"; then
      rm -f "${MY_AGENT_PID_FILE}"
      rm -f "${MY_AGENT_LOCK_FILE}"
    else
      return 2
    fi
  fi
}

#
# Function that sends a SIGHUP to the daemon/service
#
do_reload() {
  kill_by_file -HUP "${MY_AGENT_PID_FILE}"
}

do_restart() {
  if ! do_configtest; then
    return 1
  fi
  local val=0
  do_stop || val="$?"
  case "${val}" in
  0 | 1 )
    if ! do_start; then
      return 1
    fi
    ;;
  * ) # Failed to stop
    return 1
    ;;
  esac
}

do_configtest() {
  eval "${MY_AGENT_ARGS} ${START_STOP_DAEMON_ARGS} --dry-run -q"
}

RETVAL=0
case "$1" in
"start" )
  echo -n "Starting ${MY_AGENT_NAME}: "
  do_start || RETVAL="$?"
  case "$RETVAL" in
  0 )
    log_success_msg "${MY_AGENT_NAME}"
    ;;
  * )
    log_failure_msg "${MY_AGENT_NAME}"
    exit 1
    ;;
  esac
  ;;
"stop" )
  echo -n "Stopping ${MY_AGENT_NAME}: "
  do_stop || RETVAL="$?"
  case "$RETVAL" in
  0 )
    log_success_msg "${MY_AGENT_NAME}"
    ;;
  * )
    log_failure_msg "${MY_AGENT_NAME}"
    exit 1
    ;;
  esac
  ;;
"reload" )
  echo -n "Reloading ${MY_AGENT_NAME}: "
  if ! do_configtest; then
    log_failure_msg "${MY_AGENT_NAME}"
    exit 1
  fi
  if do_reload; then
    log_success_msg "${MY_AGENT_NAME}"
  else
    log_failure_msg "${MY_AGENT_NAME}"
    exit 1
  fi
  ;;
"restart" )
  echo -n "Restarting ${MY_AGENT_NAME}: "
  if do_restart; then
    log_success_msg "${MY_AGENT_NAME}"
  else
    log_failure_msg "${MY_AGENT_NAME}"
    exit 1
  fi
  ;;
"status" )
  if kill_by_file -0 "${MY_AGENT_PID_FILE}"; then
    log_success_msg "${MY_AGENT_NAME} is running"
  else
    log_failure_msg "${MY_AGENT_NAME} is not running"
    exit 1
  fi
  ;;
"condrestart" )
  if [ -f "${MY_AGENT_LOCK_FILE}" ]; then
    echo -n "Restarting ${MY_AGENT_NAME}: "
    if do_restart; then
      log_success_msg "${MY_AGENT_NAME}"
    else
      log_failure_msg "${MY_AGENT_NAME}"
      exit 1
    fi
  fi
  ;;
"configtest" )
  if do_configtest; then
    log_success_msg "${MY_AGENT_NAME}"
  else
    log_failure_msg "${MY_AGENT_NAME}"
    exit 1
  fi
  ;;
* )
  echo "Usage: $0 {start|stop|reload|restart|condrestart|status|configtest}" >&2
  exit 1
  ;;
esac
Conclusion
나만의 에이전트를 만들어보았습니다. (별것아니쥬?)
지금까지 td-agent과 유사하게, ruby와 기타 등등의 라이브러리/플러그인들을 패키징하는 나만의 fluentd 에이전트를 만들어보는 과정에 대해서 이야기를 해보았습니다. 물론, 범용적인 td-agent를 잘 활용해보는 방법도 있겠지만, 타 부서와의 혼용된 환경을 방지하고자, 나만의 에이전트로 패키징을 해보았습니다. 남은 것은 패키징한 나만의 에이전트에 나만의 요구사항을 잘 얹어서, 서비스 모니터링을 최적으로 유지시키는 것이겠죠.
각자의 서비스에 맞는 좋은 사례가 공유되었으면 하는 마음으로.. 오늘 포스팅을 마칩니다. 🙂