Fluentd? 나만의 에이전트 패키징!

Overview

세상에는 수많은 모니터링 도구들이 있습니다. 최근 많이 사용하고 있는 시계열 데이터베이스인 Prometheus와 수많은 exporter가 그중 하나입죠. 매트릭 수집에 최적화된 이런 구성은 시스템의 상태 값을 수집하기에는 더없이 좋은 시스템이기는 합니다만, 로그성 데이터 수집(에러로그 혹은 syslog)에는 아무래도 한계를 가집니다.

이 경우, td-agent와 같은 범용적인 로그 수집 에이전트를 활용하게 되는데요. (혹은 자체적으로 구현을 하거나) 타팀과 혼재해서 사용하는 경우 문제 발생소지가 있긴합니다. 참고로, td-agent는 ruby 뿐만 아니라, 필요한 라이브러리들을 패키지 내부에 포함시켜서, OS 의존성을 최소화합니다.

오늘 포스팅에서는 td-agent와 같이 fluentd를 패키징하는 방법에 대해서 이야기를 해보도록 하겠습니다.

Packaging environment

이제부터 이야기할 내용은 기본적으로 CentOS7 기반을 전제로 합니다. 참고로, CentOS6 경우에는 EOL 여파인지 모르지만.. YUM 레파지토리 관리 뿐만 아니라.. 소소한 몇몇 문제가 있어서. 조금 귀찮아지더라고요. 🙂

패키징 환경을 구성하기 위한 방안은 Docker를 이용해보는 방법과 Vagrant를 활용하여 빠르게 OS이미지를 받아오는 방법이죠.

1. Docker

Docker가 정상적으로 구성이 되어 있는 환경에서, 아래와 같이 간단하게 CentOS7 환경을 만들어보겠습니다. 만약 centos:7 이미지가 없으면, 자동으로 이미지를 받아와서 컨테이너를 잘 만들어줍니다.

$ docker run -d -it --name=pkg-dev centos:7 bash
$ docker exec -it pkg-dev bash
[root@f02a337793f9 /]# yum -y install net-tools sysstat telnet bash wget openssl md5 tar bzip2 patch gcc git autoconf openssl-devel

2. Vagrant

VirtualBox를 쓸 수 있는 환경이라면, Vargrant도 좋은 대안이기도 합니다. 여기서는 맥북 환경 기준으로 vagrant 구성해보도록 하겠습니다.

## Install vagrant with brew
$ brew install cask
$ brew install --cask virtualbox
$ brew install --cask vagrant
$ brew install --cask vagrant-manager
 
$ echo 'export PATH=$PATH:/opt/vagrant/bin:.' >> ~/.zshrc
$ . ~/.zshrc

$ mkdir -p ~/Document/vagrant/centos7-node01
$ cd ~/Document/vagrant/centos7-node01

## Vagrant file 
$ echo "
Vagrant.configure('2') do |config|
  config.vm.box = 'centos/7'
  # config.vm.network "private_network", ip: "192.168.56.60"
  config.vm.provider 'virtualbox' do |vb|
    vb.gui = true
    vb.memory = '2048'
    vb.customize ['modifyvm', :id, '--audio', 'none']
  end
  config.vm.provision 'shell', inline: <<-SHELL
    yum update -y
    yum -y install net-tools sysstat telnet bash wget openssl md5 tar bzip2 patch gcc git autoconf openssl-devel
    echo 'test12' | passwd --stdin root
    sed -i 's/PasswordAuthentication no/PasswordAuthentication yes/g' /etc/ssh/sshd_config   
    /sbin/service sshd restart
  SHELL
end" > Vagrantfile

vagrant up

참고로, 위 Vagrant 파일은 2G 메모리(vb.memory = ‘2048’)와 사용전 필요할만한 것들은 이것저것(?) 설치를 하고, root 패스워드를 'test12'로 구성하는 설정입니다. 만약 내부네트워크를 구성하고 싶다면, 위 설정에서 주석을 풀고 아이피를 적당하게 변경하시고 vagrant up 을 수행하면 됩니다.

이것 외에도 사실.. KVM을 활용한 리눅스 자체에서 Virtual machine을 생성하는 방법도 있지만, 이건 스킵! 🙂

이제 나만의 패키징을 위한 OS 세팅은 완료되었으니, 이제부터 제대로 시작을 해보도록 하겠습니다.

Ruby packaging

Fluentd는 기본적으로 ruby 위에서 구동되는 프로그램입니다. 그리고 최종적인 목표는 아래 그림과 같이, 패키징한 루비 위에, fluentd를 구성하고, 기타 필요한 fluentd 전용 플러그인을 설치하는 것입니다.

첫번째 단계로 우선 Ruby를 특정 디렉토리 안에 패키징을 해보죠. 이것을 위해 ruby-install 이라는 유틸리티를 사용토록 하겠습니다.
https://github.com/postmodern/ruby-install

########################
## Disable ssl 
########################
$ echo "sslverify=false" >> /etc/yum.conf"
$ yum -y install make

########################
# ruby-install
########################
$ export V_RUBY_INSTALL="0.8.2"
$ wget -O ruby-install-${V_RUBY_INSTALL}.tar.gz https://github.com/postmodern/ruby-install/archive/v${V_RUBY_INSTALL}.tar.gz
$ tar -xzvf ruby-install-${V_RUBY_INSTALL}.tar.gz
$ cd ruby-install-${V_RUBY_INSTALL}/
$ make install

########################
# embeded-ruby
########################
$ export V_RUBY="2.7.4"
$ export LD_LIBRARY_PATH=/opt/my-agent/lib
$ export PATH=$PATH:/opt/my-agent/bin
$ ruby-install --install-dir /opt/my-agent ruby ${V_RUBY} -- --enable-shared CPPFLAGS=-I/opt/my-agent/include LDFLAGS=-L/opt/my-agent/lib

이 과정을 거치고나면, /opt/my-agent 하단에 하단 같은 모습으로 구성되어 있는 것을 확인해볼 수 있습니다.

$ ls -al /opt/my-agent
total 24
drwxr-xr-x 6 root root 4096 Sep  2 08:06 .
drwxr-xr-x 1 root root 4096 Sep  2 08:06 ..
drwxr-xr-x 2 root root 4096 Sep  2 08:06 bin
drwxr-xr-x 3 root root 4096 Sep  2 08:06 include
drwxr-xr-x 3 root root 4096 Sep  2 08:06 lib
drwxr-xr-x 5 root root 4096 Sep  2 08:06 share

이제 fluentd 패키징을 위한 Ruby 환경 구성은 마무리되었습니다.

Install fluentd

Ruby가 패키징이 잘 이루어졌으니. 이제 fluentd를 루비 환경에 잘 넣어보도록 하겠습니다.

## fluentd
$ cd /opt/my-agent
$ ./bin/gem install fluentd
$ ./bin/fluentd -s conf
Installed conf/fluent.conf.

$ ls -al
total 28
drwxr-xr-x 7 root root 4096 Sep  2 09:04 .
drwxr-xr-x 1 root root 4096 Sep  2 08:06 ..
drwxr-xr-x 2 root root 4096 Sep  2 09:03 bin
drwxr-xr-x 3 root root 4096 Sep  2 09:04 conf
drwxr-xr-x 3 root root 4096 Sep  2 08:06 include
drwxr-xr-x 3 root root 4096 Sep  2 08:06 lib
drwxr-xr-x 5 root root 4096 Sep  2 08:06 share

이제 각각 필요할만한 라이브러리들을 컴파일하면서 /opt/my-agent/lib에 넣어보도록 해보죠. jemalloc, libyaml, openssl이 없을수도 있을만한 환경을 위해서, 아래와 같이 각각 컴파일을 해서 진행합니다. 그리고, mysql을 직접적으로 접근할 수도 있기에, mysql client 관련 라이브러리도 하단과 같이 잘 포함시켜 줍니다.

## jemalloc
$ cd ${HOME}
$ git clone https://github.com/jemalloc/jemalloc.git
$ cd jemalloc
$ ./autogen.sh --prefix=/opt/my-agent
$ make && make install
 
## libyaml
$ cd ${HOME}
$ export V_LIB_YAML="0.2.5"
$ wget --no-check-certificate http://pyyaml.org/download/libyaml/yaml-${V_LIB_YAML}.tar.gz
$ tar xzvf yaml-${V_LIB_YAML}.tar.gz
$ cd yaml-${V_LIB_YAML}
$ ./configure --prefix /opt/my-agent
$ make && make install
 
## openssl
$ cd ${HOME}
$ export V_OPENSSL="1.1.1"
$ wget https://www.openssl.org/source/old/${V_OPENSSL}/openssl-${V_OPENSSL}.tar.gz
$ tar xzvf openssl-${V_OPENSSL}.tar.gz
$ cd openssl-${V_OPENSSL}
$ ./config --prefix=/opt/my-agent
$ make && make install
 
## mysql client
$ cd ${HOME}
$ yum -y install mysql-devel mysql-libs
$ cp -R /usr/lib64/mysql/libmysqlclient* /opt/my-agent/lib/
$ mkdir -p /opt/my-agent/include
$ cp -R /usr/include/mysql /opt/my-agent/include/

자! 이제 기본적인 fluentd 패키징은 완료하였습니다. 이제부터는 필요한 플러그인들을 설치할 단계입니다.

Install fluentd plugins

제 입장에서는 사용해볼만한 플로그인은 크게 아래 세가지로 꼽아볼 수 있을 듯 하네요.

$ cd /opt/my-agent/bin
$ ./gem install fluent-plugin-out-http 
$ ./gem install fluent-plugin-mysqlslowquery
$ ./gem install fluent-plugin-mysql-query

각 플러그인에 간단하게 설명을 해보죠.

3.1. fluent-plugin-out-http

source로부터 전달받은 내용을 특정 HTTP API로 전달하는 플러그인으로, 저는 개인적으로 에러로그 수집에 활용을 해보고 있습니다. 에러로그 수집을 위한 샘플입니다. 참고로, http://192.168.56.101:5000/errorlog 수집 API 는 별도로 구현을 해야하는 것은 아시죠? (기회가 된다면, 이것도 한번. 코드로 공유를. ㅎㅎ)

<source>
  @type tail
  path /data/mysql/*.err
  pos_file /opt/my-agent/log/mysql.error.pos
  tag mysql.error
  format none
</source>
 
<filter mysql.error>
  @type record_transformer
  enable_ruby
  <record>
    hostname ${hostname}
    timestamp ${time.to_i}
  </record>
</filter>
 
<match mysql.error>
  @type http
  buffer_type file
  buffer_path /opt/my-agent/log/mysql.error.*.buffer
  flush_interval 1s
  endpoint_url   http://192.168.56.101:5000/errorlog
  http_method    post
  #serializer     json
  #bulk_request   true
</match>

v1.2.2에서는 라인단위로 명시된 endpoint_url을 매번 호출하는 형태로 구현이 되어 있었습니다.

# bulk_request: false
error line1 ========> API call
error line2 ========> API call
error line3 ========> API call
error line4 ========> API call
error line5 ========> API call

# bulk_request: true
error line1 
error line2 
error line3 
error line4 
error line5 ========> API call (line1~line5)

일반적인 상황에서는 큰 문제가 되지 않지만, 몇천 라인의 에러로그가 순식간에 생성이 되었을 때.. 수집 효율이 굉장히 떨어질 수 밖에 없겠죠. 현 버전에서는 bulk_request옵션이 추가되면서, 대략 1MB 미만(600K~800K)으로 데이터를 끊어서 application/x-ndjson로 묶어서 API를 호출합니다. (한번에 전달받은 메시지를 묶어서 디비 insert 처리를 하니, 만건 로그도 큰 무리없이 한번에 잘 넣긴 하네요. ㅎ)

옵션에 대한 추가 내용은 하단 깃을 읽어보시고, 필요한 것들을 잘 사용해보면 좋겠네요. ^^
https://github.com/fluent-plugins-nursery/fluent-plugin-out-http

3.2. fluent-plugin-mysqlslowquery

MySQL 슬로우 쿼리 수집을 위한 플러그인으로.. 슬로우 로그 위치를 지정해놓으면, 잘 파싱해서 전달해줍니다. 아래는 샘플 설정입니다.

<source>
  @type mysql_slow_query
  path /var/lib/mysql/mysql-slow.log
  tag mysql.slow
  <parse>
    @type none
  </parse>
</source>
 
<match mysql.slow>
  @type http
  buffer_type file
  buffer_path /opt/uldra-agent/log/mysql.slow.*.buffer
  flush_interval 1s
  endpoint_url    http://192.168.56.101:5000/slowlog
  serializer      json
  bulk_request    true
  http_method     post
</match>

사실 이 플러그인이 편리하기는 하지만.. 문제는 한번에 다량의 슬로우 쿼리가 발생했을 시.. 이 플러그인에서 무한정 리소스를 먹기 때문에.. 개인적으로는 활용하고 있지는 않습니다. 이렇게 활용할 바에는 차라리, 앞선 에러로그 수집과 같은 방식으로 tail로 소스를 받아서 병합을 API 서버 레벨에서 해주는 것이 훨씬 안정적이고 유리할 듯 하네요. ^^

그리고, 아쉽게도. 이 프로젝트는 더이상 개발이 되지 않는듯한? (혹은 다른 어디선가 새롭게? ㅎㅎ)
https://github.com/yuku/fluent-plugin-mysqlslowquery

3.3. fluent-plugin-mysql-query

MySQL에 쿼리를 날려서 데이터를 추출하는 플러그인 입니다. fluentd로 주기적으로 데이터베이스로부터 데이터를 추출해서 결과를 타겟으로 던질 때 좋을만한 플러그인입니다.

<source>
  @type           mysql_query
  host            127.0.0.1
  port            3306
  username        fluentd
  password        fluentd123
  interval        30s
  tag             mysql-query-01
  query           select 'chan' j, now() t;
  record_hostname yes
  nest_result     yes                 # Optional (default: no)
  nest_key        data                # Optional (default: result)
  row_count       yes                 # Optional (default: no)
  row_count_key   row_count           # Optional (default: row_count)
</source>
 
<match mysql-query-01>
  @type http
  buffer_type file
  buffer_path /opt/db-agent/log/mysql.query01.*.buffer
  flush_interval 1s
  endpoint_url    http://192.168.56.101:5000/query
  http_method     post
  serializer      json
  bulk_request    true
  http_method     post
</match>

개인적으로는 사용하고 있지는 않지만.. 향후 필요한 경우 요긴하게 활용하기 위해 저는 기본적으로 넣어놓습니다.
https://github.com/y-ken/fluent-plugin-mysql-query

Startup script

td-agent의 init.d 스크립트를 약간의 변경(?)을 주어서 구성해보았습니다. 중간 부분을 보게되면, jemalloc으로 프로그램을 구동하는 것을 확인할 수 있습니다.

#!/bin/sh
### BEGIN INIT INFO
# Provides:          my-agent
# Required-Start:    $network $local_fs
# Required-Stop:     $network $local_fs
# Default-Start:     2 3 4 5
# Default-Stop:      0 1 6
# Short-Description: data collector for Treasure Data
# Description:       my-agent is a data collector
### END INIT INFO
# pidfile:           /opt/my-agent/my-agent.pid
 
export PATH=/sbin:/opt/my-agent/sbin:/bin:/usr/bin
 
MY_AGENT_NAME=my-agent
MY_AGENT_HOME=/opt/my-agent
MY_AGENT_DEFAULT=/etc/sysconfig/my-agent
MY_AGENT_USER=root
MY_AGENT_GROUP=root
MY_AGENT_RUBY=${MY_AGENT_HOME}/bin/ruby
MY_AGENT_BIN_FILE=${MY_AGENT_HOME}/sbin/my-agent
MY_AGENT_LOG_FILE=${MY_AGENT_HOME}/log/my-agent.log
MY_AGENT_PID_FILE=${MY_AGENT_HOME}/my-agent.pid
MY_AGENT_LOCK_FILE=/var/lock/subsys/my-agent
MY_AGENT_OPTIONS="--use-v1-config"
 
# timeout can be overridden from /etc/sysconfig/my-agent
STOPTIMEOUT=120
 
# Read configuration variable file if it is present
if [ -f "${MY_AGENT_DEFAULT}" ]; then
  . "${MY_AGENT_DEFAULT}"
fi
 
# Arguments to run the daemon with
MY_AGENT_ARGS="${MY_AGENT_ARGS:-${MY_AGENT_BIN_FILE} --log ${MY_AGENT_LOG_FILE} ${MY_AGENT_OPTIONS}}"
START_STOP_DAEMON_ARGS="${START_STOP_DAEMON_ARGS}"
 
# Exit if the package is not installed
[ -x "${MY_AGENT_RUBY}" ] || exit 0
 
# Source function library.
. /etc/init.d/functions
 
# Define LSB log_* functions.
lsb_functions="/lib/lsb/init-functions"
if test -f $lsb_functions ; then
  . $lsb_functions
else
  log_success_msg()
  {
    echo " SUCCESS! $@"
  }
  log_failure_msg()
  {
    echo " ERROR! $@"
  }
  log_warning_msg()
  {
    echo " WARNING! $@"
  }
fi
 
# Check the user
if [ -n "${MY_AGENT_USER}" ]; then
  if ! getent passwd | grep -q "^${MY_AGENT_USER}:"; then
    echo "$0: user for running ${MY_AGENT_NAME} doesn't exist: ${MY_AGENT_USER}" >&2
    exit 1
  fi
  mkdir -p "$(dirname "${MY_AGENT_PID_FILE}")"
  chown -R "${MY_AGENT_USER}" "$(dirname "${MY_AGENT_PID_FILE}")"
  START_STOP_DAEMON_ARGS="${START_STOP_DAEMON_ARGS} --user ${MY_AGENT_USER}"
fi
 
if [ -n "${MY_AGENT_GROUP}" ]; then
  if ! getent group -s files | grep -q "^${MY_AGENT_GROUP}:"; then
    echo "$0: group for running ${MY_AGENT_NAME} doesn't exist: ${MY_AGENT_GROUP}" >&2
    exit 1
  fi
  MY_AGENT_ARGS="${MY_AGENT_ARGS} --group ${MY_AGENT_GROUP}"
fi
 
if [ -n "${MY_AGENT_PID_FILE}" ]; then
  mkdir -p "$(dirname "${MY_AGENT_PID_FILE}")"
  chown -R "${MY_AGENT_USER}" "$(dirname "${MY_AGENT_PID_FILE}")"
  MY_AGENT_ARGS="${MY_AGENT_ARGS} --daemon ${MY_AGENT_PID_FILE}"
fi
 
# 2012/04/17 Kazuki Ohta <k@treasure-data.com>
# Use jemalloc to avoid memory fragmentation
if [ -f "${MY_AGENT_HOME}/lib/libjemalloc.so" ]; then
  export LD_PRELOAD="${MY_AGENT_HOME}/lib/libjemalloc.so"
fi
 
kill_by_file() {
  local sig="$1"
  shift 1
  local pid="$(cat "$@" 2>/dev/null || true)"
  if [ -n "${pid}" ]; then
    if /bin/kill "${sig}" "${pid}" 1>/dev/null 2>&1; then
      return 0
    else
      return 2
    fi
  else
    return 1
  fi
}
 
#
# Function that starts the daemon/service
#
do_start() {
  # Set Max number of file descriptors for the safety sake
  # see http://docs.fluentd.org/en/articles/before-install
  ulimit -n 65536 1>/dev/null 2>&1 || true
  local RETVAL=0
  daemon --pidfile="${MY_AGENT_PID_FILE}" ${START_STOP_DAEMON_ARGS} "${MY_AGENT_RUBY}" ${MY_AGENT_ARGS} || RETVAL="$?"
  [ $RETVAL -eq 0 ] && touch "${MY_AGENT_LOCK_FILE}"
  return $RETVAL
}
 
#
# Function that stops the daemon/service
#
do_stop() {
  # Return
  #   0 if daemon has been stopped
  #   1 if daemon was already stopped
  #   2 if daemon could not be stopped
  #   other if a failure occurred
  if [ -e "${MY_AGENT_PID_FILE}" ]; then
    # Use own process termination instead of killproc because killproc can't wait SIGTERM
    if kill_by_file -TERM "${MY_AGENT_PID_FILE}"; then
      local i
      for i in $(seq "${STOPTIMEOUT}"); do
        if kill_by_file -0 "${MY_AGENT_PID_FILE}"; then
          sleep 1
        else
          break
        fi
      done
      if kill_by_file -0 "${MY_AGENT_PID_FILE}"; then
        echo -n "Timeout error occurred trying to stop ${MY_AGENT_NAME}..."
        return 2
      else
        rm -f "${MY_AGENT_PID_FILE}"
        rm -f "${MY_AGENT_LOCK_FILE}"
      fi
    else
      return 1
    fi
  else
    if killproc "${MY_AGENT_PROG_NAME:-${MY_AGENT_NAME}}"; then
      rm -f "${MY_AGENT_PID_FILE}"
      rm -f "${MY_AGENT_LOCK_FILE}"
    else
      return 2
    fi
  fi
}
 
#
# Function that sends a SIGHUP to the daemon/service
#
do_reload() {
  kill_by_file -HUP "${MY_AGENT_PID_FILE}"
}
 
do_restart() {
  if ! do_configtest; then
    return 1
  fi
  local val=0
  do_stop || val="$?"
  case "${val}" in
  0 | 1 )
    if ! do_start; then
      return 1
    fi
    ;;
  * ) # Failed to stop
    return 1
    ;;
  esac
}
 
do_configtest() {
  eval "${MY_AGENT_ARGS} ${START_STOP_DAEMON_ARGS} --dry-run -q"
}
 
RETVAL=0
case "$1" in
"start" )
  echo -n "Starting ${MY_AGENT_NAME}: "
  do_start || RETVAL="$?"
  case "$RETVAL" in
  0 )
    log_success_msg "${MY_AGENT_NAME}"
    ;;
  * )
    log_failure_msg "${MY_AGENT_NAME}"
    exit 1
    ;;
  esac
  ;;
"stop" )
  echo -n "Stopping ${MY_AGENT_NAME}: "
  do_stop || RETVAL="$?"
  case "$RETVAL" in
  0 )
    log_success_msg "${MY_AGENT_NAME}"
    ;;
  * )
    log_failure_msg "${MY_AGENT_NAME}"
    exit 1
    ;;
  esac
  ;;
"reload" )
  echo -n "Reloading ${MY_AGENT_NAME}: "
  if ! do_configtest; then
    log_failure_msg "${MY_AGENT_NAME}"
    exit 1
  fi
  if do_reload; then
    log_success_msg "${MY_AGENT_NAME}"
  else
    log_failure_msg "${MY_AGENT_NAME}"
    exit 1
  fi
  ;;
"restart" )
  echo -n "Restarting ${MY_AGENT_NAME}: "
  if do_restart; then
    log_success_msg "${MY_AGENT_NAME}"
  else
    log_failure_msg "${MY_AGENT_NAME}"
    exit 1
  fi
  ;;
"status" )
  if kill_by_file -0 "${MY_AGENT_PID_FILE}"; then
    log_success_msg "${MY_AGENT_NAME} is running"
  else
    log_failure_msg "${MY_AGENT_NAME} is not running"
    exit 1
  fi
  ;;
"condrestart" )
  if [ -f "${MY_AGENT_LOCK_FILE}" ]; then
    echo -n "Restarting ${MY_AGENT_NAME}: "
    if do_restart; then
      log_success_msg "${MY_AGENT_NAME}"
    else
      log_failure_msg "${MY_AGENT_NAME}"
      exit 1
    fi
  fi
  ;;
"configtest" )
  if do_configtest; then
    log_success_msg "${MY_AGENT_NAME}"
  else
    log_failure_msg "${MY_AGENT_NAME}"
    exit 1
  fi
  ;;
* )
  echo "Usage: $0 {start|stop|reload|restart|condrestart|status|configtest}" >&2
  exit 1
  ;;
esac

Conclusion

나만의 에이전트를 만들어보았습니다. (별것아니쥬?)

지금까지 td-agent과 유사하게, ruby와 기타 등등의 라이브러리/플러그인들을 패키징하는 나만의 fluentd 에이전트를 만들어보는 과정에 대해서 이야기를 해보았습니다. 물론, 범용적인 td-agent를 잘 활용해보는 방법도 있겠지만, 타 부서와의 혼용된 환경을 방지하고자, 나만의 에이전트로 패키징을 해보았습니다. 남은 것은 패키징한 나만의 에이전트에 나만의 요구사항을 잘 얹어서, 서비스 모니터링을 최적으로 유지시키는 것이겠죠.

각자의 서비스에 맞는 좋은 사례가 공유되었으면 하는 마음으로.. 오늘 포스팅을 마칩니다. 🙂

MySQL document store 초간단 테스트

Overview

MySQL을 마치 NoSQL의 저장소처럼 써보겠다는 Document Store!! 만약 memcached plugin처럼 native한 프로토콜로 스토리지 엔진에서 직접적인 데이터 처리를 할 것 같은 꿈만 같은 저장소로 느껴졌습니만..

결론적으로 이야기해보자면….. 단순히 json 타입의 컬럼에 데이터를 넣고 빼기위한 프로토콜일 뿐.. 모든 것이 쿼리로 변환이 되어서 데이터 처리가 이루어집니다.

이에 대해 간단한 테스트 내용을 공유해봅니다.

Installation

도큐먼스스토어를 활성화시키는 것은 간단합니다. 아래와 같이 mysqlx.so 플러그인만 설치를 하면 됩니다.

## mysql.session@localhost 계정이 존재해야함.
mysql> INSTALL PLUGIN mysqlx SONAME 'mysqlx.so';

mysql> show variables like '%mysqlx_port%';
+--------------------------+-------+
| Variable_name            | Value |
+--------------------------+-------+
| mysqlx_port              | 33060 |
| mysqlx_port_open_timeout | 0     |
+--------------------------+-------+
2 rows in set (0.00 sec)

mysql> \! netstat -an | grep 33060
tcp46      0      0  *.33060                *.*                    LISTEN

참고로, mysql.session 계정이 있어야, 정상적으로 동작합니다. (Docker로 테스트하시는 분들은. ^^ 이부분 유념해주세요.) 이제 테스트를 하기위한 테이블과 데이터를 만들어봅니다.

mysql> CREATE TABLE `doc01` (
    ->   `i` int(11) NOT NULL AUTO_INCREMENT,
    ->   `doc` json DEFAULT NULL,
    ->   PRIMARY KEY (`i`)
    -> )
mysql> insert into doc01 (doc) values ('{"age": 30, "gender": "man", "info": "dev1"}');
mysql> insert into doc01 (doc) values ('{"age": 31, "gender": "man", "info": "dev2"}');
mysql> insert into doc01 (doc) values ('{"age": 32, "gender": "man", "info": "dev3"}');
mysql> insert into doc01 (doc) values ('{"age": 30, "gender": "man", "info": "dev4"}');

mysql> select * from doc01;
+---+----------------------------------------------+
| i | doc                                          |
+---+----------------------------------------------+
| 1 | {"age": 30, "info": "dev1", "gender": "man"} |
| 2 | {"age": 31, "info": "dev2", "gender": "man"} |
| 3 | {"age": 32, "info": "dev3", "gender": "man"} |
| 4 | {"age": 30, "info": "dev4", "gender": "man"} |
+---+----------------------------------------------+
4 rows in set (0.00 sec)

Java test code

공식 문서에는 다양한 클라이언트(python / js / c# / c++ / java) 등을 제공을 합니다. 다만.. golang 이 공식적으로 없다하니. 왠지 서글픈 기분이 드는구먼요. ㅠㅠ

import com.mysql.cj.xdevapi.*;

public class MyTest {
  public static void main(String[] argv) throws Exception {
    Session mySession = new SessionFactory().getSession("mysqlx://127.0.0.1:33060/test?user=root&password=root");
    Schema myDb = mySession.getSchema("test");
    Collection myColl = myDb.getCollection("doc01");
    DocResult myDocs = myColl.find("age = :age").limit(10).bind("age", 30).execute();
    System.out.println(myDocs.fetchAll());
    mySession.close();
  }
}

이 코드를 수행하고 나면, 아래와 같이 테이블에 있는 데이터들이 json 형태로 내려옵니다.

[{"age":30,"gender":"man","info":"dev1"}, {"age":30,"gender":"man","info":"dev4"}]

참고로, 만약 다른 테이블을 바라보고 싶다면, 아래와 같이 Collection의 위치를 변경해서 수행을 하면 됩니다.

Collection myColl = myDb.getCollection("doc01");

General log (Query log)

제가 위 코드를 바탕으로 확인해보고 싶은 포인트는 정확히 한가지입니다. 데이터 처리 시 파싱 단계 없이, 바로 스토리지 엔진에서 데이터를 끌어오는 것인지!! (의외로 파싱과 옵티마이저 단계가 많은 CPU 리소스를 소모합니다. 특히나, OLTP로 몬스터급 단순 쿼리를 날리는 경우!)

만약 InnoDB memcached plugin이나 Handler socket처럼, 별도의 파싱과정 없이 바로 스토리지 엔진에서 데이터를 처리하는 구조라면, 해볼 수 있는 것들이 대단히 많아질 것입니다. 우리에게는 MySQL replication이라는 강력한 복제툴이 있기에. 비휘발성 도큐멘트 스토어도 꿈꿔볼 수 있겠죠.

아쉽게도.. 요청이 아래와 같이 SELECT 쿼리로 컨버팅되어서 처리되는 것을 확인해볼 수 있었습니다. ㅠㅠ

2021-07-27T20:28:01.346521Z       34 Query    SELECT doc FROM `test`.`doc01` WHERE (JSON_EXTRACT(doc,'$.age') = 30) LIMIT 10

Conclusion

개인적인 생각으로는.. mysql을 도큐먼트 스토어로 Key/Value로 사용한다는 것 외에는 딱히 좋은 점이 떠오리지 않았습니다.
제대로 성능 테스트를 해봐야겠지만. General log에 찍혀있는 결과로만 봐서는 InnoDB memcached plugin보다 무엇이 더 유리할지..? 물론, READ촛점이고, JSON타입의 편의성을 생각해보면, 다른 결론을 내볼 수 있겠지만요.

그러나, 성능/효율 측면에서 아쉬움이 남는 개인적인 결론을 지으며, 이번 블로그를 마무리합니다.

Go언어로 나만의 Query Exporter 만들어보기!

Overview

안녕하세요. 무더운 7월 잘 지내고 계시죠.?

오늘은 조금 특이한 주제를 가지고 이야기를 해보고자 합니다. 바로 go로 나만의 Exporter를 만들어보는 것입니다. 특정 쿼리를 등록을 해놓으면, 이 쿼리 결과를 Exporter 결과로 보여주는 간단한 프로그램입니다. 아직 Expoter가 무엇인지 생소하신 분들이 있을 수 있겠는데요. 오늘 차근차근 설명을 하면서, 머릿속에 살짝 인스톨해드리도록 하겠습니다. 🙂

Exporter?

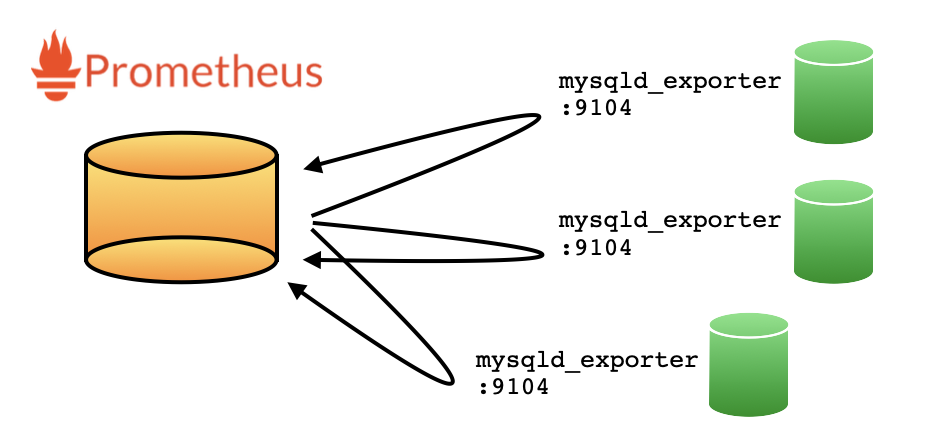
Exporter란, Prometheus같은 시계열 데이터베이스에서 데이터를 끌어가기 위한 하나의 HTTP 서버라고 생각하면 되겠습니다. Prometheus에서는 정해진 주기에 따라 exporter의 특정 URL을 호출하고, 그 결과값을 시계열로 데이터를 저장합니다.

prometheus & exporter

세상에는 수많은 Exporter들이 존재하죠. 대표적으로는 Prometheus의 Offcial프로젝트들인 mysqld_expoter가 있고, Percona에서는 이를 Fork 해서 자기들이 추가로 배포하는 mysqld_expoter도 있습니다. 이것 외에도 Linux 노드를 모니터링을 위한 node_expoter 뿐만 아니라, memcached_expoter 등등.. 아주 다양한 exporter들이 존재하죠.
오늘 이 자리에서 할 내용은, 이 다양한 Exporter중에 나만의 새로운 Exporter 하나를 더 추가해보는 과정입니다.

Go 프로젝트 생성하기

Exporter는 다양한 언어로 구현을 할 수 있습니다만, 오늘은 golang으로 구현을 해보도록 하죠. 아무래도, 배포 및 호환성 측면에서 golang 만큼 편리(?)한 것은 없다고 개인적으로 생각하고 있습니다. 여기서 go 설치 및 환경 구성에 대한 것은 생략하도록 하겠습니다.

$ cd ~/go/src

$ mkdir -p query-exporter-simple

$ cd query-exporter-simple

$ go mod init
go: creating new go.mod: module query-exporter-simple

$ ls -al
total 8
drwxr-xr-x   3 chan  staff   96  7 12 13:33 .
drwxr-xr-x  12 chan  staff  384  7 12 13:33 ..
-rw-r--r--   1 chan  staff   38  7 12 13:33 go.mod

$ cat go.mod
module query-exporter-simple

go 1.16

비록 깡통(?) 프로젝트이기는 하지만, 이제 나만의 exporter를 만들기 위한 모든 준비는 완료하였습니다. 이제부터 패키지 관리는 go mod로 관리합니다.

깡통 Exporter 맛보기

자, 이제부터 본격적(?)으로 Exporter를 만들어보도록 하겠습니다. 먼저 맛보기로, 아~무 기능 없는.. 단순히 go version 정도만 출력을 해주는 깡통 Exporter를 만들어보도록 해보죠.

package main

import (
    "flag"
)

func main() {
    // =====================
    // Get OS parameter
    // =====================
    var bind string
    flag.StringVar(&bind, "bind", "0.0.0.0:9104", "bind")
    flag.Parse()
}

flag를 활용하여 OS 파라메터를 읽어오는 내용입니다. Exporter가 구동 시 뜰 서버 바인딩 정보입니다.

package main

import (
    "flag"
    "net/http"

    "github.com/prometheus/client_golang/prometheus"
    "github.com/prometheus/client_golang/prometheus/promhttp"
    "github.com/prometheus/common/version"
    log "github.com/sirupsen/logrus"
)

func main() {
    // =====================
    // Get OS parameter
    // =====================
    var bind string
    flag.StringVar(&bind, "bind", "0.0.0.0:9104", "bind")
    flag.Parse()

    // ========================
    // Regist handler
    // ========================
    prometheus.Register(version.NewCollector("query_exporter"))

    // Regist http handler
    http.HandleFunc("/metrics", func(w http.ResponseWriter, r *http.Request) {
        h := promhttp.HandlerFor(prometheus.Gatherers{
            prometheus.DefaultGatherer,
        }, promhttp.HandlerOpts{})
        h.ServeHTTP(w, r)
    })

    // start server
    log.Infof("Starting http server - %s", bind)
    if err := http.ListenAndServe(bind, nil); err != nil {
        log.Errorf("Failed to start http server: %s", err)
    }
}

수집할 Collector를 등록하고, HTTP server로 Exporter를 구동합니다. Collector는 정보를 수집해주는 하나의 쓰레드(?) 개념으로, Prometheus의 Collector 인터페이스를 구현한 구조체라고 생각하면 쉽게 이해가 되겠습니다.

$ go mod vendor
go: finding module for package github.com/prometheus/common/version
go: finding module for package github.com/prometheus/client_golang/prometheus
go: finding module for package github.com/sirupsen/logrus
go: finding module for package github.com/prometheus/client_golang/prometheus/promhttp
go: found github.com/prometheus/client_golang/prometheus in github.com/prometheus/client_golang v1.11.0
go: found github.com/prometheus/client_golang/prometheus/promhttp in github.com/prometheus/client_golang v1.11.0
go: found github.com/prometheus/common/version in github.com/prometheus/common v0.29.0
go: found github.com/sirupsen/logrus in github.com/sirupsen/logrus v1.8.1

$ ls -al
total 112
drwxr-xr-x   6 chan  staff    192  7 13 10:26 .
drwxr-xr-x  12 chan  staff    384  7 12 13:33 ..
-rw-r--r--   1 chan  staff    169  7 13 10:26 go.mod
-rw-r--r--   1 chan  staff  45722  7 13 10:26 go.sum
-rw-r--r--   1 chan  staff   1163  7 13 10:34 main.go
drwxr-xr-x   6 chan  staff    192  7 13 10:26 vendor

아직 go가 사용하는 패키지들이 프로젝트에 존재하지 않기 때문에, 수많은 에러가 발생할 것입니다. 그래서 위와 같이 go mod vendor 를 통하여 관련 패키지를 받아옵니다. 관련 패키지는 vendor 디렉토리 하단에 위치하게 됩니다.

$ go run .
INFO[0000] Regist version collector - query_exporter
INFO[0000] HTTP handler path - /metrics
INFO[0000] Starting http server - 0.0.0.0:9104

Exporter 서버를 구동시켜보면, 이제 9104 포트(flag에서 기본값으로 지정한 포트)로 서버가 구동될 것입니다.

$ go run . --bind=0.0.0.0:9105
INFO[0000] Regist version collector - query_exporter
INFO[0000] HTTP handler path - /metrics
INFO[0000] Starting http server - 0.0.0.0:9105

만약 포트 변경을 하고 싶다면, 위와 같이 바인딩 정보를 주면 해당 포트로 서버가 구동하겠죠.

$ curl 127.0.0.1:9104/metrics
# HELP go_gc_duration_seconds A summary of the pause duration of garbage collection cycles.
# TYPE go_gc_duration_seconds summary
go_gc_duration_seconds{quantile="0"} 0
go_gc_duration_seconds{quantile="0.25"} 0

.. 중략 ..

# HELP go_threads Number of OS threads created.
# TYPE go_threads gauge
go_threads 7
# HELP query_exporter_build_info A metric with a constant '1' value labeled by version, revision, branch, and goversion from which query_exporter was built.
# TYPE query_exporter_build_info gauge
query_exporter_build_info{branch="",goversion="go1.16.5",revision="",version=""} 1

비록 깡통 Exporter임에도 불구하고.. 아주 많은 정보들이 Exporter를 통해 추출되는 것을 확인할 수 있습니다. (대부분의 정보는 go 자체에 대한 정보이기는 합자만..)

가장 하단을 보시면, query_exporter_build_info 메트릭이 들어있는데, 이것이 바로 앞선 부분에서 추가했던 그 Collector가 수집한 정보입니다. 깡통 Exporter를 만들어낸 순간입니다! 감격. ㅠ_ㅠ

본격적으로 Exporter 만들기

조금 전에, 버전 정도만 명시해주는 깡통 Exporter를 만들어보았습니다. 참 쉽죠? ㅎㅎ
이제부터는 우리가 정말로 필요한 정보들을 수집해서, 그 결과를 HTTP GET 메쏘드 호출 결과로 뿌려주는 Collector를 구현해볼 생각입니다. query exporter

Configuration format (YAML)

앞서 이야기한 것처럼, 등록한 쿼리의 결과를 Exporter 결과 매트릭으로 뿌리는 것을 만들고자 합니다. 그러기 위해서는 타겟 인스턴스에 대한 정보도 알아야할 것이고, 실제 실행할 쿼리에 대해서도 알고 있어야겠죠.

dsn: test:test123@tcp(127.0.0.1:3306)/information_schema
metrics:
  process_count_by_host:
    query: "select user, substring_index(host, ':', 1) host, count(*) sessions from information_schema.processlist group by 1,2 "
    type: gauge
    description: "process count by host"
    labels: ["user","host"]
    value: sessions
  process_count_by_user:
    query: "select user, count(*) sessions from information_schema.processlist group by 1 "
    type: gauge
    description: "process count by user"
    labels: ["user"]
    value: sessions

위와 같은 포멧으로 설정을 해보도록 하겠습니다. MySQL 접속 정보와, 실제로 수행할 쿼리입니다. “호스트 별 커넥션 수”“유저별 커넥션 수” 두 가지 정보를 결과로 보여줄 것입니다.

type Config struct {
    DSN     string
    Metrics map[string]struct {
        Query       string
        Type        string
        Description string
        Labels      []string
        Value       string
        metricDesc  *prometheus.Desc
    }
}

위 yaml 을 go 구조체로 정의를 해보았습니다. 여기서 metricDesc *prometheus.Desc는 (뒤에서 설명하겠지만) Prometheus 메트릭에서 사용하는 스펙 명세서(?)라고 이해를 해보면 되겠네요. 이 안에는 어떤 Label과 Counter/Gauge같은 메트릭 타입에 대한것도 같이 명시되어 있습니다.

var b []byte
var config Config
if b, err = ioutil.ReadFile("config.yml"); err != nil {
    log.Errorf("Failed to read config file: %s", err)
    os.Exit(1)
}

// Load yaml
if err := yaml.Unmarshal(b, &config); err != nil {
    log.Errorf("Failed to load config: %s", err)
    os.Exit(1)
}

YAML파일을 위와 같이 읽어서, 최종적으로 앞서 정의한 구조체에 설정 정보를 로딩해봅니다.

package main

import (
    "flag"
    "io/ioutil"
    "net/http"
    "os"

    "github.com/ghodss/yaml"
    "github.com/prometheus/client_golang/prometheus"
    "github.com/prometheus/client_golang/prometheus/promhttp"
    "github.com/prometheus/common/version"
    log "github.com/sirupsen/logrus"
)

var config Config

func main() {
    var err error
    var configFile, bind string
    // =====================
    // Get OS parameter
    // =====================
    flag.StringVar(&configFile, "config", "config.yml", "configuration file")
    flag.StringVar(&bind, "bind", "0.0.0.0:9104", "bind")
    flag.Parse()

    // =====================
    // Load config & yaml
    // =====================
    var b []byte
    if b, err = ioutil.ReadFile(configFile); err != nil {
        log.Errorf("Failed to read config file: %s", err)
        os.Exit(1)
    }

    // Load yaml
    if err := yaml.Unmarshal(b, &config); err != nil {
        log.Errorf("Failed to load config: %s", err)
        os.Exit(1)
    }

    // ========================
    // Regist handler
    // ========================
    log.Infof("Regist version collector - %s", "query_exporter")
    prometheus.Register(version.NewCollector("query_exporter"))

    // Regist http handler
    log.Infof("HTTP handler path - %s", "/metrics")
    http.HandleFunc("/metrics", func(w http.ResponseWriter, r *http.Request) {
        h := promhttp.HandlerFor(prometheus.Gatherers{
            prometheus.DefaultGatherer,
        }, promhttp.HandlerOpts{})
        h.ServeHTTP(w, r)
    })

    // start server
    log.Infof("Starting http server - %s", bind)
    if err := http.ListenAndServe(bind, nil); err != nil {
        log.Errorf("Failed to start http server: %s", err)
    }
}

// =============================
// Config config structure
// =============================
type Config struct {
    DSN     string
    Metrics map[string]struct {
        Query       string
        Type        string
        Description string
        Labels      []string
        Value       string
        metricDesc  *prometheus.Desc
    }
}

이렇게 하면, 이제 필요한 정보를 Config 구조체에 담아서, 이를 활용하여 원하는 구현을 해볼 수 있겠습니다.

Collector 구현해보기

오늘 포스팅의 하이라이트.. 바로 원하는 정보를 수집해보기 위한 Collector를 구현해보는 과정입니다.
지금까지 모든 과정은, 직접 구현한 Collector가 수집한 정보를 HTTP 결과로 보여주기 위한 것이었습니다. Collector에서는 실제로 DB에 접속을 해서 정해진 쿼리를 수행한 결과를 바탕으로 지정한 metric 결과를 전달하는 과정을 품습니다.

type QueryCollector struct{}

// Describe prometheus describe
func (e *QueryCollector) Describe(ch chan<- *prometheus.Desc) {
}

// Collect prometheus collect
func (e *QueryCollector) Collect(ch chan<- prometheus.Metric) {
}

앞서 이야기한 것 처럼, Collector는 정보를 수집해주는 하나의 쓰레드(?) 개념으로, Prometheus의 Collector 인터페이스를 구현한 구조체입니다. 즉, 이 이야기는 만약 나만의 또다른 Collector를 생성하기 위해서는 prometheus.Collector 인터페이스가 정의한 Describe와 Collect 두 가지 정도는 반드시 구현을 해야한다는 것입니다.

func main(){
    .. skip ..
    // ========================
    // Regist handler
    // ========================
    log.Infof("Regist version collector - %s", "query_exporter")
    prometheus.Register(version.NewCollector("query_exporter"))
    prometheus.Register(&QueryCollector{})
    .. skip ..
}

위에서 정의한 Collector를 위와 같이 등록을 해줍니다. 앞서 생성한 깡통 Exporter에 추가했던 Version Collector와 이번에 새롭게 추가한 QueryCollector가 등록됩니다. “/metric”으로 http 요청이 들어오면, 최종적으로는 위 두개의 Collector가 각각의 쓰레드로 수행됩니다.

1. Describe 함수 만들기

각각 메트릭들의 스펙을 정의하는 부분입니다. 사실 반드시 여기에서 메트릭의 스펙을 정의할 필요는 없지만, 여러개의 Collector를 만들어서 운영하는 경우를 생각해본다면, 유용합니다. prometheus.Register 로 Collector가 등록될 시 단 한번 수행되는 메쏘드입니다.

func (e *QueryCollector) Describe(ch chan<- *prometheus.Desc) {
    for metricName, metric := range config.Metrics {
        metric.metricDesc = prometheus.NewDesc(
            prometheus.BuildFQName("query_exporter", "", metricName),
            metric.Description,
            metric.Labels, nil,
        )
        config.Metrics[metricName] = metric
        log.Infof("metric description for \"%s\" registerd", metricName)
    }
}

저는 여기서 앞서 읽어들인 설정 정보에서 Query 관련된 정보로 메트릭의 스펙을 정의하였습니다.

  • prometheus.BuildFQName: 메트릭 명
  • metric.Description: 설명
  • metric.Labels: 라벨명 배열, 이 순서로 라벨값들이 추후 맵핑되어야 함

설정 정보를 보면, 아래와 같이 각각 맵핑이 되겠네요.

metrics:
  # metricName
  process_count_by_user:
    ## metric.Description
    description: "process count by user"
    ## metric.Labels
    labels: ["user"]

2. Collect 함수 만들기

DB에 접속해서, 원하는 SQL 을 실행한 이후 이를 metric으로 만들어주는 부분입니다. 각 쿼리의 실행 결과들은 아래 그림과 같이 지정된 이름의 메트릭명으로 결과로 보여지게 됩니다.

metric results
func (e *QueryCollector) Collect(ch chan<- prometheus.Metric) {

    // Connect to database
    db, err := sql.Open("mysql", config.DSN)
    if err != nil {
        log.Errorf("Connect to database failed: %s", err)
        return
    }
    defer db.Close()

    // Execute each queries in metrics
    for name, metric := range config.Metrics {

        // Execute query
        rows, err := db.Query(metric.Query)
        if err != nil {
            log.Errorf("Failed to execute query: %s", err)
            continue
        }

        // Get column info
        cols, err := rows.Columns()
        if err != nil {
            log.Errorf("Failed to get column meta: %s", err)
            continue
        }

        des := make([]interface{}, len(cols))
        res := make([][]byte, len(cols))
        for i := range cols {
            des[i] = &res[i]
        }

        // fetch database
        for rows.Next() {
            rows.Scan(des...)
            data := make(map[string]string)
            for i, bytes := range res {
                data[cols[i]] = string(bytes)
            }

            // Metric labels
            labelVals := []string{}
            for _, label := range metric.Labels {
                labelVals = append(labelVals, data[label])
            }

            // Metric value
            val, _ := strconv.ParseFloat(data[metric.Value], 64)

            // Add metric
            switch strings.ToLower(metric.Type) {
            case "counter":
                ch <- prometheus.MustNewConstMetric(metric.metricDesc, prometheus.CounterValue, val, labelVals...)
            case "gauge":
                ch <- prometheus.MustNewConstMetric(metric.metricDesc, prometheus.GaugeValue, val, labelVals...)
            default:
                log.Errorf("Fail to add metric for %s: %s is not valid type", name, metric.Type)
                continue
            }
        }
    }
}

labelVals 값에서 볼 수 있듯이, 앞서 Describe에서 정의한 스펙의 Labels 순으로 라벨 값 순서로 전달을 해야합니다. 여기서 counter와 gauge 두 개의 메트릭 타입이 있습니다. 각각의 타입은 아래와 같이 의미를 갖습니다.

  • COUNTER: 증가만 하는 값, prometheus에서는 rate/irate 와 같은 변화량 계산 함수로 지표를 보여줌
    ch <- prometheus.MustNewConstMetric(metric.metricDesc, prometheus.CounterValue, val, labelVals...)
  • GAUGE: 자동차 게이지와 같이, 값이 증가/감소할 수 있는 타입. 일반적으로 프로세스 카운트와 같이 현재 지표 값 그대로 저장할 시 사용
    ch <- prometheus.MustNewConstMetric(metric.metricDesc, prometheus.GaugeValue, val, labelVals...)

    지표로 보여줄 값은 설정에 지정했던 value 항목을 쿼리 결과에서 가져와서 메트릭 value 값으로 저장합니다.

QueryExporter Source

지금까지의 모든 내용들을 취합해보면 아래와 같습니다.

package main

import (
    "database/sql"
    "flag"
    "io/ioutil"
    "net/http"
    "os"
    "strconv"
    "strings"

    "github.com/ghodss/yaml"
    _ "github.com/go-sql-driver/mysql"
    "github.com/prometheus/client_golang/prometheus"
    "github.com/prometheus/client_golang/prometheus/promhttp"
    "github.com/prometheus/common/version"
    log "github.com/sirupsen/logrus"
)

var config Config

const (
    collector = "query_exporter"
)

func main() {
    var err error
    var configFile, bind string
    // =====================
    // Get OS parameter
    // =====================
    flag.StringVar(&configFile, "config", "config.yml", "configuration file")
    flag.StringVar(&bind, "bind", "0.0.0.0:9104", "bind")
    flag.Parse()

    // =====================
    // Load config & yaml
    // =====================
    var b []byte
    if b, err = ioutil.ReadFile(configFile); err != nil {
        log.Errorf("Failed to read config file: %s", err)
        os.Exit(1)
    }

    // Load yaml
    if err := yaml.Unmarshal(b, &config); err != nil {
        log.Errorf("Failed to load config: %s", err)
        os.Exit(1)
    }

    // ========================
    // Regist handler
    // ========================
    log.Infof("Regist version collector - %s", collector)
    prometheus.Register(version.NewCollector(collector))
    prometheus.Register(&QueryCollector{})

    // Regist http handler
    log.Infof("HTTP handler path - %s", "/metrics")
    http.HandleFunc("/metrics", func(w http.ResponseWriter, r *http.Request) {
        h := promhttp.HandlerFor(prometheus.Gatherers{
            prometheus.DefaultGatherer,
        }, promhttp.HandlerOpts{})
        h.ServeHTTP(w, r)
    })

    // start server
    log.Infof("Starting http server - %s", bind)
    if err := http.ListenAndServe(bind, nil); err != nil {
        log.Errorf("Failed to start http server: %s", err)
    }
}

// =============================
// Config config structure
// =============================
type Config struct {
    DSN     string
    Metrics map[string]struct {
        Query       string
        Type        string
        Description string
        Labels      []string
        Value       string
        metricDesc  *prometheus.Desc
    }
}

// =============================
// QueryCollector exporter
// =============================
type QueryCollector struct{}

// Describe prometheus describe
func (e *QueryCollector) Describe(ch chan<- *prometheus.Desc) {
    for metricName, metric := range config.Metrics {
        metric.metricDesc = prometheus.NewDesc(
            prometheus.BuildFQName(collector, "", metricName),
            metric.Description,
            metric.Labels, nil,
        )
        config.Metrics[metricName] = metric
        log.Infof("metric description for \"%s\" registerd", metricName)
    }
}

// Collect prometheus collect
func (e *QueryCollector) Collect(ch chan<- prometheus.Metric) {

    // Connect to database
    db, err := sql.Open("mysql", config.DSN)
    if err != nil {
        log.Errorf("Connect to database failed: %s", err)
        return
    }
    defer db.Close()

    // Execute each queries in metrics
    for name, metric := range config.Metrics {

        // Execute query
        rows, err := db.Query(metric.Query)
        if err != nil {
            log.Errorf("Failed to execute query: %s", err)
            continue
        }

        // Get column info
        cols, err := rows.Columns()
        if err != nil {
            log.Errorf("Failed to get column meta: %s", err)
            continue
        }

        des := make([]interface{}, len(cols))
        res := make([][]byte, len(cols))
        for i := range cols {
            des[i] = &res[i]
        }

        // fetch database
        for rows.Next() {
            rows.Scan(des...)
            data := make(map[string]string)
            for i, bytes := range res {
                data[cols[i]] = string(bytes)
            }

            // Metric labels
            labelVals := []string{}
            for _, label := range metric.Labels {
                labelVals = append(labelVals, data[label])
            }

            // Metric value
            val, _ := strconv.ParseFloat(data[metric.Value], 64)

            // Add metric
            switch strings.ToLower(metric.Type) {
            case "counter":
                ch <- prometheus.MustNewConstMetric(metric.metricDesc, prometheus.CounterValue, val, labelVals...)
            case "gauge":
                ch <- prometheus.MustNewConstMetric(metric.metricDesc, prometheus.GaugeValue, val, labelVals...)
            default:
                log.Errorf("Fail to add metric for %s: %s is not valid type", name, metric.Type)
                continue
            }
        }
    }
}

만약 패키지가 없다면, go mod vendor를 수행해서 필요한 패키지들을 다운로드 받아보도록 합니다.

$ go run .
INFO[0000] Regist version collector - query_exporter
INFO[0000] metric description for "process_count_by_host" registerd
INFO[0000] metric description for "process_count_by_user" registerd
INFO[0000] HTTP handler path - /metrics
INFO[0000] Starting http server - 0.0.0.0:9104

서버를 구동하고, 실제 Exporter에서 수집하는 정보를 확인해봅니다.

$ curl 127.0.0.1:9104/metrics
# HELP go_gc_duration_seconds A summary of the pause duration of garbage collection cycles.
# TYPE go_gc_duration_seconds summary
go_gc_duration_seconds{quantile="0"} 0
go_gc_duration_seconds{quantile="0.25"} 0

.. skip ..

# HELP query_exporter_build_info A metric with a constant '1' value labeled by version, revision, branch, and goversion from which query_exporter was built.
# TYPE query_exporter_build_info gauge
query_exporter_build_info{branch="",goversion="go1.16.5",revision="",version=""} 1
# HELP query_exporter_process_count_by_host process count by host
# TYPE query_exporter_process_count_by_host gauge
query_exporter_process_count_by_host{host="localhost",user="event_scheduler"} 1
query_exporter_process_count_by_host{host="localhost",user="test"} 1
# HELP query_exporter_process_count_by_user process count by user
# TYPE query_exporter_process_count_by_user gauge
query_exporter_process_count_by_user{user="event_scheduler"} 1
query_exporter_process_count_by_user{user="test"} 1

curl로 실행은 해보면, 설정에 정의를 했던 유저별/호스트별 세션 카운트가 정상적으로 보여지는 것을 확인할 수 있습니다.
나만의 Exporter가 만들어진 순간입니다. 🙂

마치며..

포스팅이 굉장히 길었습니다. 소스코드를 몇번이고 본문에 넣었더니.. 내용없이 본문 양만 길어진 느낌적인 느낌;;;
어찌됐건 나만의 고유한 Exporter를 만들어냈습니다! 저는 단순히 쿼리를 등록하여 이 결과를 메트릭 결과로 추출해보는 간단한 기능을 구현했지만, 필요에 따라서 더 많은 재미요소를 각자의 생각에 맞게 가미해볼 수 있을 것 같네요.

참고로, 다음 Git에 위에서 작성한 소스는 정리하였습니다.
https://github.com/go-gywn/query-exporter-simple

때로는 하나의 장비에서 수십~수백대의 장비들을 모니터링을 해야할 때.. 중앙에서 메트릭 수집을 관리하는 것이 유용할 때가 있었습니다. 아직은 MySQL만 기능이 제공되지만, 이런 요구사항을 해결하기 위해, 개인적으로 또다른 Query Exporter 프로젝트를 만들어보았습니다. 위 프로제트 베이스에 병렬처리와 타임아웃 같은 기타 등등을 더 구현해보았습니다.
https://github.com/go-gywn/query-exporter

늘 그래왔지만.. 없으면, 만들면 되고.. 있으면 잘 갖다 쓰면 되겠죠? 모든 것을 만들어볼 수는 없을테니. ㅎㅎ

즐거운 한여름 되세요. 🙂