Overview
안녕하세요. 무더운 7월 잘 지내고 계시죠.?
오늘은 조금 특이한 주제를 가지고 이야기를 해보고자 합니다. 바로 go로 나만의 Exporter를 만들어보는 것입니다. 특정 쿼리를 등록을 해놓으면, 이 쿼리 결과를 Exporter 결과로 보여주는 간단한 프로그램입니다. 아직 Expoter가 무엇인지 생소하신 분들이 있을 수 있겠는데요. 오늘 차근차근 설명을 하면서, 머릿속에 살짝 인스톨해드리도록 하겠습니다. 🙂
Exporter?
Exporter란, Prometheus같은 시계열 데이터베이스에서 데이터를 끌어가기 위한 하나의 HTTP 서버라고 생각하면 되겠습니다. Prometheus에서는 정해진 주기에 따라 exporter의 특정 URL을 호출하고, 그 결과값을 시계열로 데이터를 저장합니다.
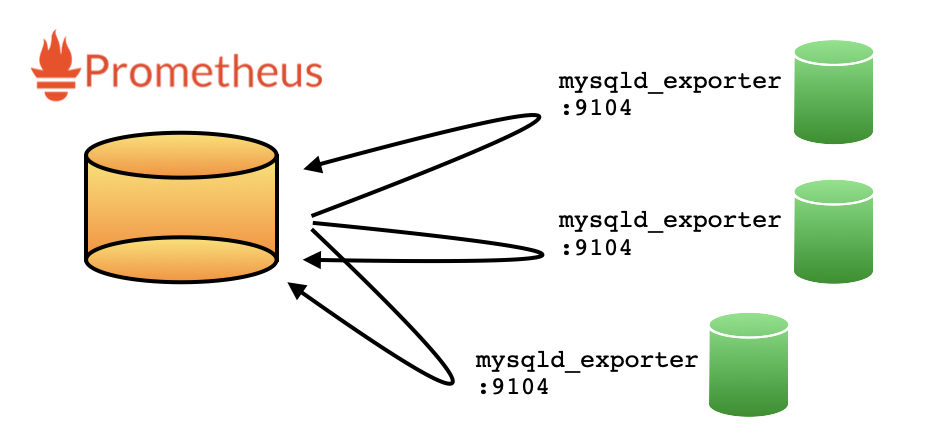
세상에는 수많은 Exporter들이 존재하죠. 대표적으로는 Prometheus의 Offcial프로젝트들인 mysqld_expoter가 있고, Percona에서는 이를 Fork 해서 자기들이 추가로 배포하는 mysqld_expoter도 있습니다. 이것 외에도 Linux 노드를 모니터링을 위한 node_expoter 뿐만 아니라, memcached_expoter 등등.. 아주 다양한 exporter들이 존재하죠.
오늘 이 자리에서 할 내용은, 이 다양한 Exporter중에 나만의 새로운 Exporter 하나를 더 추가해보는 과정입니다.
Go 프로젝트 생성하기
Exporter는 다양한 언어로 구현을 할 수 있습니다만, 오늘은 golang으로 구현을 해보도록 하죠. 아무래도, 배포 및 호환성 측면에서 golang 만큼 편리(?)한 것은 없다고 개인적으로 생각하고 있습니다. 여기서 go 설치 및 환경 구성에 대한 것은 생략하도록 하겠습니다.
$ cd ~/go/src

$ mkdir -p query-exporter-simple

$ cd query-exporter-simple

$ go mod init
go: creating new go.mod: module query-exporter-simple

$ ls -al
total 8
drwxr-xr-x   3 chan  staff   96  7 12 13:33 .
drwxr-xr-x  12 chan  staff  384  7 12 13:33 ..
-rw-r--r--   1 chan  staff   38  7 12 13:33 go.mod

$ cat go.mod
module query-exporter-simple

go 1.16
비록 깡통(?) 프로젝트이기는 하지만, 이제 나만의 exporter를 만들기 위한 모든 준비는 완료하였습니다. 이제부터 패키지 관리는 go mod로 관리합니다.
깡통 Exporter 맛보기
자, 이제부터 본격적(?)으로 Exporter를 만들어보도록 하겠습니다. 먼저 맛보기로, 아~무 기능 없는.. 단순히 go version 정도만 출력을 해주는 깡통 Exporter를 만들어보도록 해보죠.
package main

import (
    "flag"
)

func main() {
    // =====================
    // Get OS parameter
    // =====================
    var bind string
    flag.StringVar(&bind, "bind", "0.0.0.0:9104", "bind")
    flag.Parse()
}
flag를 활용하여 OS 파라메터를 읽어오는 내용입니다. Exporter가 구동 시 뜰 서버 바인딩 정보입니다.
package main

import (
    "flag"
    "net/http"

    "github.com/prometheus/client_golang/prometheus"
    "github.com/prometheus/client_golang/prometheus/promhttp"
    "github.com/prometheus/common/version"
    log "github.com/sirupsen/logrus"
)

func main() {
    // =====================
    // Get OS parameter
    // =====================
    var bind string
    flag.StringVar(&bind, "bind", "0.0.0.0:9104", "bind")
    flag.Parse()

    // ========================
    // Regist handler
    // ========================
    prometheus.Register(version.NewCollector("query_exporter"))

    // Regist http handler
    http.HandleFunc("/metrics", func(w http.ResponseWriter, r *http.Request) {
        h := promhttp.HandlerFor(prometheus.Gatherers{
            prometheus.DefaultGatherer,
        }, promhttp.HandlerOpts{})
        h.ServeHTTP(w, r)
    })

    // start server
    log.Infof("Starting http server - %s", bind)
    if err := http.ListenAndServe(bind, nil); err != nil {
        log.Errorf("Failed to start http server: %s", err)
    }
}
수집할 Collector를 등록하고, HTTP server로 Exporter를 구동합니다. Collector는 정보를 수집해주는 하나의 쓰레드(?) 개념으로, Prometheus의 Collector 인터페이스를 구현한 구조체라고 생각하면 쉽게 이해가 되겠습니다.
$ go mod vendor
go: finding module for package github.com/prometheus/common/version
go: finding module for package github.com/prometheus/client_golang/prometheus
go: finding module for package github.com/sirupsen/logrus
go: finding module for package github.com/prometheus/client_golang/prometheus/promhttp
go: found github.com/prometheus/client_golang/prometheus in github.com/prometheus/client_golang v1.11.0
go: found github.com/prometheus/client_golang/prometheus/promhttp in github.com/prometheus/client_golang v1.11.0
go: found github.com/prometheus/common/version in github.com/prometheus/common v0.29.0
go: found github.com/sirupsen/logrus in github.com/sirupsen/logrus v1.8.1

$ ls -al
total 112
drwxr-xr-x   6 chan  staff    192  7 13 10:26 .
drwxr-xr-x  12 chan  staff    384  7 12 13:33 ..
-rw-r--r--   1 chan  staff    169  7 13 10:26 go.mod
-rw-r--r--   1 chan  staff  45722  7 13 10:26 go.sum
-rw-r--r--   1 chan  staff   1163  7 13 10:34 main.go
drwxr-xr-x   6 chan  staff    192  7 13 10:26 vendor
아직 go가 사용하는 패키지들이 프로젝트에 존재하지 않기 때문에, 수많은 에러가 발생할 것입니다. 그래서 위와 같이 go mod vendor 를 통하여 관련 패키지를 받아옵니다. 관련 패키지는 vendor 디렉토리 하단에 위치하게 됩니다.
$ go run .
INFO[0000] Regist version collector - query_exporter
INFO[0000] HTTP handler path - /metrics
INFO[0000] Starting http server - 0.0.0.0:9104
Exporter 서버를 구동시켜보면, 이제 9104 포트(flag에서 기본값으로 지정한 포트)로 서버가 구동될 것입니다.
$ go run . --bind=0.0.0.0:9105
INFO[0000] Regist version collector - query_exporter
INFO[0000] HTTP handler path - /metrics
INFO[0000] Starting http server - 0.0.0.0:9105
만약 포트 변경을 하고 싶다면, 위와 같이 바인딩 정보를 주면 해당 포트로 서버가 구동하겠죠.
$ curl 127.0.0.1:9104/metrics
# HELP go_gc_duration_seconds A summary of the pause duration of garbage collection cycles.
# TYPE go_gc_duration_seconds summary
go_gc_duration_seconds{quantile="0"} 0
go_gc_duration_seconds{quantile="0.25"} 0

.. 중략 ..

# HELP go_threads Number of OS threads created.
# TYPE go_threads gauge
go_threads 7
# HELP query_exporter_build_info A metric with a constant '1' value labeled by version, revision, branch, and goversion from which query_exporter was built.
# TYPE query_exporter_build_info gauge
query_exporter_build_info{branch="",goversion="go1.16.5",revision="",version=""} 1
비록 깡통 Exporter임에도 불구하고.. 아주 많은 정보들이 Exporter를 통해 추출되는 것을 확인할 수 있습니다. (대부분의 정보는 go 자체에 대한 정보이기는 합자만..)
가장 하단을 보시면, query_exporter_build_info 메트릭이 들어있는데, 이것이 바로 앞선 부분에서 추가했던 그 Collector가 수집한 정보입니다. 깡통 Exporter를 만들어낸 순간입니다! 감격. ㅠ_ㅠ
본격적으로 Exporter 만들기
조금 전에, 버전 정도만 명시해주는 깡통 Exporter를 만들어보았습니다. 참 쉽죠? ㅎㅎ
이제부터는 우리가 정말로 필요한 정보들을 수집해서, 그 결과를 HTTP GET 메쏘드 호출 결과로 뿌려주는 Collector를 구현해볼 생각입니다. 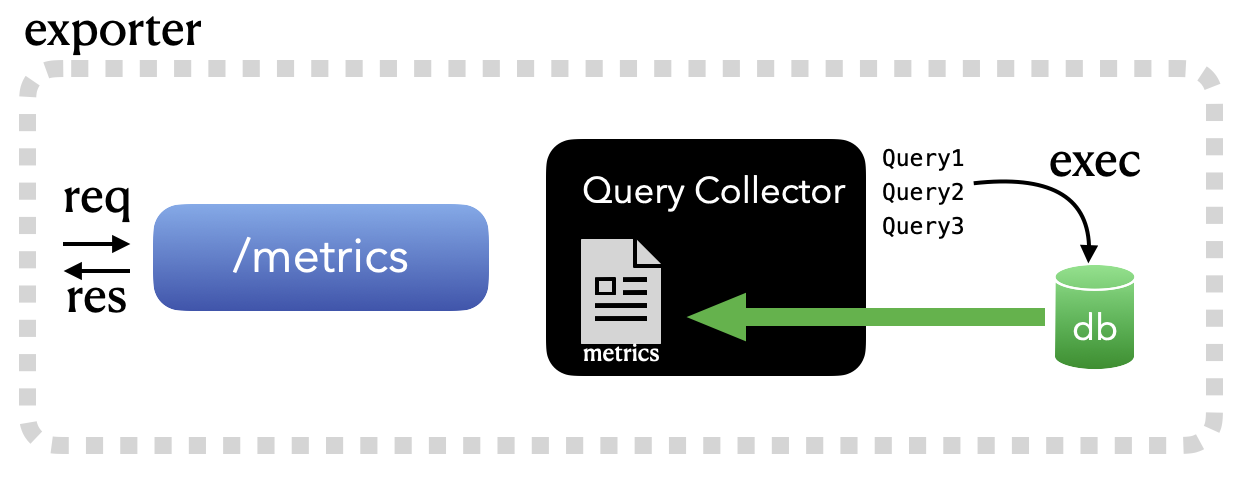
Configuration format (YAML)
앞서 이야기한 것처럼, 등록한 쿼리의 결과를 Exporter 결과 매트릭으로 뿌리는 것을 만들고자 합니다. 그러기 위해서는 타겟 인스턴스에 대한 정보도 알아야할 것이고, 실제 실행할 쿼리에 대해서도 알고 있어야겠죠.
dsn: test:test123@tcp(127.0.0.1:3306)/information_schema
metrics:
  process_count_by_host:
    query: "select user, substring_index(host, ':', 1) host, count(*) sessions from information_schema.processlist group by 1,2 "
    type: gauge
    description: "process count by host"
    labels: ["user","host"]
    value: sessions
  process_count_by_user:
    query: "select user, count(*) sessions from information_schema.processlist group by 1 "
    type: gauge
    description: "process count by user"
    labels: ["user"]
    value: sessions
위와 같은 포멧으로 설정을 해보도록 하겠습니다. MySQL 접속 정보와, 실제로 수행할 쿼리입니다. “호스트 별 커넥션 수”와 “유저별 커넥션 수” 두 가지 정보를 결과로 보여줄 것입니다.
type Config struct {
    DSN     string
    Metrics map[string]struct {
        Query       string
        Type        string
        Description string
        Labels      []string
        Value       string
        metricDesc  *prometheus.Desc
    }
}
위 yaml 을 go 구조체로 정의를 해보았습니다. 여기서 metricDesc *prometheus.Desc는 (뒤에서 설명하겠지만) Prometheus 메트릭에서 사용하는 스펙 명세서(?)라고 이해를 해보면 되겠네요. 이 안에는 어떤 Label과 Counter/Gauge같은 메트릭 타입에 대한것도 같이 명시되어 있습니다.
var b []byte
var config Config
if b, err = ioutil.ReadFile("config.yml"); err != nil {
    log.Errorf("Failed to read config file: %s", err)
    os.Exit(1)
}

// Load yaml
if err := yaml.Unmarshal(b, &config); err != nil {
    log.Errorf("Failed to load config: %s", err)
    os.Exit(1)
}
YAML파일을 위와 같이 읽어서, 최종적으로 앞서 정의한 구조체에 설정 정보를 로딩해봅니다.
package main

import (
    "flag"
    "io/ioutil"
    "net/http"
    "os"

    "github.com/ghodss/yaml"
    "github.com/prometheus/client_golang/prometheus"
    "github.com/prometheus/client_golang/prometheus/promhttp"
    "github.com/prometheus/common/version"
    log "github.com/sirupsen/logrus"
)

var config Config

func main() {
    var err error
    var configFile, bind string
    // =====================
    // Get OS parameter
    // =====================
    flag.StringVar(&configFile, "config", "config.yml", "configuration file")
    flag.StringVar(&bind, "bind", "0.0.0.0:9104", "bind")
    flag.Parse()

    // =====================
    // Load config & yaml
    // =====================
    var b []byte
    if b, err = ioutil.ReadFile(configFile); err != nil {
        log.Errorf("Failed to read config file: %s", err)
        os.Exit(1)
    }

    // Load yaml
    if err := yaml.Unmarshal(b, &config); err != nil {
        log.Errorf("Failed to load config: %s", err)
        os.Exit(1)
    }

    // ========================
    // Regist handler
    // ========================
    log.Infof("Regist version collector - %s", "query_exporter")
    prometheus.Register(version.NewCollector("query_exporter"))

    // Regist http handler
    log.Infof("HTTP handler path - %s", "/metrics")
    http.HandleFunc("/metrics", func(w http.ResponseWriter, r *http.Request) {
        h := promhttp.HandlerFor(prometheus.Gatherers{
            prometheus.DefaultGatherer,
        }, promhttp.HandlerOpts{})
        h.ServeHTTP(w, r)
    })

    // start server
    log.Infof("Starting http server - %s", bind)
    if err := http.ListenAndServe(bind, nil); err != nil {
        log.Errorf("Failed to start http server: %s", err)
    }
}

// =============================
// Config config structure
// =============================
type Config struct {
    DSN     string
    Metrics map[string]struct {
        Query       string
        Type        string
        Description string
        Labels      []string
        Value       string
        metricDesc  *prometheus.Desc
    }
}
이렇게 하면, 이제 필요한 정보를 Config 구조체에 담아서, 이를 활용하여 원하는 구현을 해볼 수 있겠습니다.
Collector 구현해보기
오늘 포스팅의 하이라이트.. 바로 원하는 정보를 수집해보기 위한 Collector를 구현해보는 과정입니다.
지금까지 모든 과정은, 직접 구현한 Collector가 수집한 정보를 HTTP 결과로 보여주기 위한 것이었습니다. Collector에서는 실제로 DB에 접속을 해서 정해진 쿼리를 수행한 결과를 바탕으로 지정한 metric 결과를 전달하는 과정을 품습니다.
type QueryCollector struct{}

// Describe prometheus describe
func (e *QueryCollector) Describe(ch chan<- *prometheus.Desc) {
}

// Collect prometheus collect
func (e *QueryCollector) Collect(ch chan<- prometheus.Metric) {
}
앞서 이야기한 것 처럼, Collector는 정보를 수집해주는 하나의 쓰레드(?) 개념으로, Prometheus의 Collector 인터페이스를 구현한 구조체입니다. 즉, 이 이야기는 만약 나만의 또다른 Collector를 생성하기 위해서는 prometheus.Collector 인터페이스가 정의한 Describe와 Collect 두 가지 정도는 반드시 구현을 해야한다는 것입니다.
func main(){
    .. skip ..
    // ========================
    // Regist handler
    // ========================
    log.Infof("Regist version collector - %s", "query_exporter")
    prometheus.Register(version.NewCollector("query_exporter"))
    prometheus.Register(&QueryCollector{})
    .. skip ..
}
위에서 정의한 Collector를 위와 같이 등록을 해줍니다. 앞서 생성한 깡통 Exporter에 추가했던 Version Collector와 이번에 새롭게 추가한 QueryCollector가 등록됩니다. “/metric”으로 http 요청이 들어오면, 최종적으로는 위 두개의 Collector가 각각의 쓰레드로 수행됩니다.
1. Describe 함수 만들기
각각 메트릭들의 스펙을 정의하는 부분입니다. 사실 반드시 여기에서 메트릭의 스펙을 정의할 필요는 없지만, 여러개의 Collector를 만들어서 운영하는 경우를 생각해본다면, 유용합니다. prometheus.Register 로 Collector가 등록될 시 단 한번 수행되는 메쏘드입니다.
func (e *QueryCollector) Describe(ch chan<- *prometheus.Desc) {
    for metricName, metric := range config.Metrics {
        metric.metricDesc = prometheus.NewDesc(
            prometheus.BuildFQName("query_exporter", "", metricName),
            metric.Description,
            metric.Labels, nil,
        )
        config.Metrics[metricName] = metric
        log.Infof("metric description for \"%s\" registerd", metricName)
    }
}
저는 여기서 앞서 읽어들인 설정 정보에서 Query 관련된 정보로 메트릭의 스펙을 정의하였습니다.
- prometheus.BuildFQName: 메트릭 명
- metric.Description: 설명
- metric.Labels: 라벨명 배열, 이 순서로 라벨값들이 추후 맵핑되어야 함
설정 정보를 보면, 아래와 같이 각각 맵핑이 되겠네요.
metrics:
  # metricName
  process_count_by_user:
    ## metric.Description
    description: "process count by user"
    ## metric.Labels
    labels: ["user"]
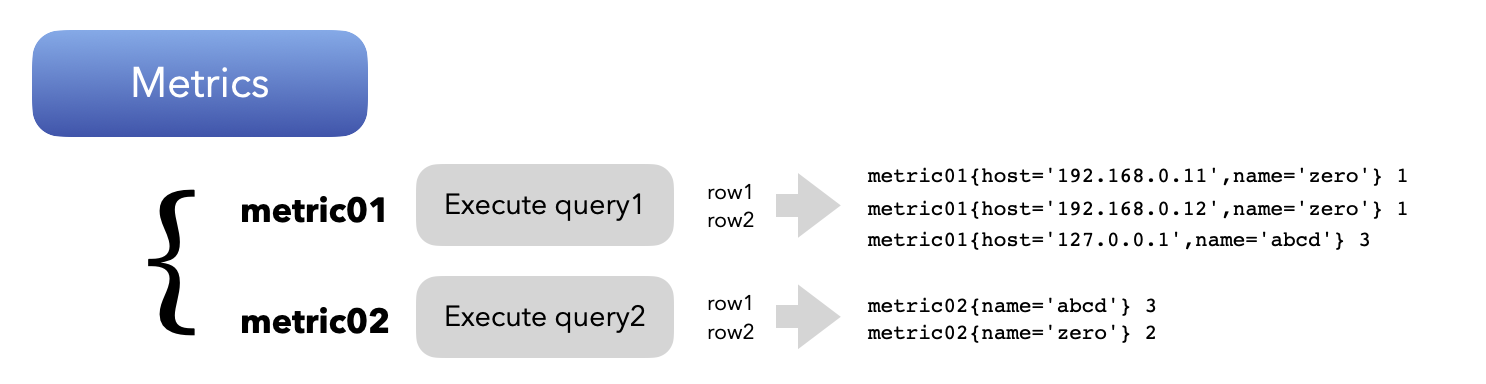
2. Collect 함수 만들기
DB에 접속해서, 원하는 SQL 을 실행한 이후 이를 metric으로 만들어주는 부분입니다. 각 쿼리의 실행 결과들은 아래 그림과 같이 지정된 이름의 메트릭명으로 결과로 보여지게 됩니다.
func (e *QueryCollector) Collect(ch chan<- prometheus.Metric) {

    // Connect to database
    db, err := sql.Open("mysql", config.DSN)
    if err != nil {
        log.Errorf("Connect to database failed: %s", err)
        return
    }
    defer db.Close()

    // Execute each queries in metrics
    for name, metric := range config.Metrics {

        // Execute query
        rows, err := db.Query(metric.Query)
        if err != nil {
            log.Errorf("Failed to execute query: %s", err)
            continue
        }

        // Get column info
        cols, err := rows.Columns()
        if err != nil {
            log.Errorf("Failed to get column meta: %s", err)
            continue
        }

        des := make([]interface{}, len(cols))
        res := make([][]byte, len(cols))
        for i := range cols {
            des[i] = &res[i]
        }

        // fetch database
        for rows.Next() {
            rows.Scan(des...)
            data := make(map[string]string)
            for i, bytes := range res {
                data[cols[i]] = string(bytes)
            }

            // Metric labels
            labelVals := []string{}
            for _, label := range metric.Labels {
                labelVals = append(labelVals, data[label])
            }

            // Metric value
            val, _ := strconv.ParseFloat(data[metric.Value], 64)

            // Add metric
            switch strings.ToLower(metric.Type) {
            case "counter":
                ch <- prometheus.MustNewConstMetric(metric.metricDesc, prometheus.CounterValue, val, labelVals...)
            case "gauge":
                ch <- prometheus.MustNewConstMetric(metric.metricDesc, prometheus.GaugeValue, val, labelVals...)
            default:
                log.Errorf("Fail to add metric for %s: %s is not valid type", name, metric.Type)
                continue
            }
        }
    }
}
labelVals 값에서 볼 수 있듯이, 앞서 Describe에서 정의한 스펙의 Labels 순으로 라벨 값 순서로 전달을 해야합니다. 여기서 counter와 gauge 두 개의 메트릭 타입이 있습니다. 각각의 타입은 아래와 같이 의미를 갖습니다.
- COUNTER: 증가만 하는 값, prometheus에서는 rate/irate 와 같은 변화량 계산 함수로 지표를 보여줌
ch <- prometheus.MustNewConstMetric(metric.metricDesc, prometheus.CounterValue, val, labelVals...) - GAUGE: 자동차 게이지와 같이, 값이 증가/감소할 수 있는 타입. 일반적으로 프로세스 카운트와 같이 현재 지표 값 그대로 저장할 시 사용
ch <- prometheus.MustNewConstMetric(metric.metricDesc, prometheus.GaugeValue, val, labelVals...)지표로 보여줄 값은 설정에 지정했던 value 항목을 쿼리 결과에서 가져와서 메트릭 value 값으로 저장합니다.
QueryExporter Source
지금까지의 모든 내용들을 취합해보면 아래와 같습니다.
package main

import (
    "database/sql"
    "flag"
    "io/ioutil"
    "net/http"
    "os"
    "strconv"
    "strings"

    "github.com/ghodss/yaml"
    _ "github.com/go-sql-driver/mysql"
    "github.com/prometheus/client_golang/prometheus"
    "github.com/prometheus/client_golang/prometheus/promhttp"
    "github.com/prometheus/common/version"
    log "github.com/sirupsen/logrus"
)

var config Config

const (
    collector = "query_exporter"
)

func main() {
    var err error
    var configFile, bind string
    // =====================
    // Get OS parameter
    // =====================
    flag.StringVar(&configFile, "config", "config.yml", "configuration file")
    flag.StringVar(&bind, "bind", "0.0.0.0:9104", "bind")
    flag.Parse()

    // =====================
    // Load config & yaml
    // =====================
    var b []byte
    if b, err = ioutil.ReadFile(configFile); err != nil {
        log.Errorf("Failed to read config file: %s", err)
        os.Exit(1)
    }

    // Load yaml
    if err := yaml.Unmarshal(b, &config); err != nil {
        log.Errorf("Failed to load config: %s", err)
        os.Exit(1)
    }

    // ========================
    // Regist handler
    // ========================
    log.Infof("Regist version collector - %s", collector)
    prometheus.Register(version.NewCollector(collector))
    prometheus.Register(&QueryCollector{})

    // Regist http handler
    log.Infof("HTTP handler path - %s", "/metrics")
    http.HandleFunc("/metrics", func(w http.ResponseWriter, r *http.Request) {
        h := promhttp.HandlerFor(prometheus.Gatherers{
            prometheus.DefaultGatherer,
        }, promhttp.HandlerOpts{})
        h.ServeHTTP(w, r)
    })

    // start server
    log.Infof("Starting http server - %s", bind)
    if err := http.ListenAndServe(bind, nil); err != nil {
        log.Errorf("Failed to start http server: %s", err)
    }
}

// =============================
// Config config structure
// =============================
type Config struct {
    DSN     string
    Metrics map[string]struct {
        Query       string
        Type        string
        Description string
        Labels      []string
        Value       string
        metricDesc  *prometheus.Desc
    }
}

// =============================
// QueryCollector exporter
// =============================
type QueryCollector struct{}

// Describe prometheus describe
func (e *QueryCollector) Describe(ch chan<- *prometheus.Desc) {
    for metricName, metric := range config.Metrics {
        metric.metricDesc = prometheus.NewDesc(
            prometheus.BuildFQName(collector, "", metricName),
            metric.Description,
            metric.Labels, nil,
        )
        config.Metrics[metricName] = metric
        log.Infof("metric description for \"%s\" registerd", metricName)
    }
}

// Collect prometheus collect
func (e *QueryCollector) Collect(ch chan<- prometheus.Metric) {

    // Connect to database
    db, err := sql.Open("mysql", config.DSN)
    if err != nil {
        log.Errorf("Connect to database failed: %s", err)
        return
    }
    defer db.Close()

    // Execute each queries in metrics
    for name, metric := range config.Metrics {

        // Execute query
        rows, err := db.Query(metric.Query)
        if err != nil {
            log.Errorf("Failed to execute query: %s", err)
            continue
        }

        // Get column info
        cols, err := rows.Columns()
        if err != nil {
            log.Errorf("Failed to get column meta: %s", err)
            continue
        }

        des := make([]interface{}, len(cols))
        res := make([][]byte, len(cols))
        for i := range cols {
            des[i] = &res[i]
        }

        // fetch database
        for rows.Next() {
            rows.Scan(des...)
            data := make(map[string]string)
            for i, bytes := range res {
                data[cols[i]] = string(bytes)
            }

            // Metric labels
            labelVals := []string{}
            for _, label := range metric.Labels {
                labelVals = append(labelVals, data[label])
            }

            // Metric value
            val, _ := strconv.ParseFloat(data[metric.Value], 64)

            // Add metric
            switch strings.ToLower(metric.Type) {
            case "counter":
                ch <- prometheus.MustNewConstMetric(metric.metricDesc, prometheus.CounterValue, val, labelVals...)
            case "gauge":
                ch <- prometheus.MustNewConstMetric(metric.metricDesc, prometheus.GaugeValue, val, labelVals...)
            default:
                log.Errorf("Fail to add metric for %s: %s is not valid type", name, metric.Type)
                continue
            }
        }
    }
}
만약 패키지가 없다면, go mod vendor를 수행해서 필요한 패키지들을 다운로드 받아보도록 합니다.
$ go run .
INFO[0000] Regist version collector - query_exporter
INFO[0000] metric description for "process_count_by_host" registerd
INFO[0000] metric description for "process_count_by_user" registerd
INFO[0000] HTTP handler path - /metrics
INFO[0000] Starting http server - 0.0.0.0:9104
서버를 구동하고, 실제 Exporter에서 수집하는 정보를 확인해봅니다.
$ curl 127.0.0.1:9104/metrics
# HELP go_gc_duration_seconds A summary of the pause duration of garbage collection cycles.
# TYPE go_gc_duration_seconds summary
go_gc_duration_seconds{quantile="0"} 0
go_gc_duration_seconds{quantile="0.25"} 0

.. skip ..

# HELP query_exporter_build_info A metric with a constant '1' value labeled by version, revision, branch, and goversion from which query_exporter was built.
# TYPE query_exporter_build_info gauge
query_exporter_build_info{branch="",goversion="go1.16.5",revision="",version=""} 1
# HELP query_exporter_process_count_by_host process count by host
# TYPE query_exporter_process_count_by_host gauge
query_exporter_process_count_by_host{host="localhost",user="event_scheduler"} 1
query_exporter_process_count_by_host{host="localhost",user="test"} 1
# HELP query_exporter_process_count_by_user process count by user
# TYPE query_exporter_process_count_by_user gauge
query_exporter_process_count_by_user{user="event_scheduler"} 1
query_exporter_process_count_by_user{user="test"} 1
curl로 실행은 해보면, 설정에 정의를 했던 유저별/호스트별 세션 카운트가 정상적으로 보여지는 것을 확인할 수 있습니다.
나만의 Exporter가 만들어진 순간입니다. 🙂
마치며..
포스팅이 굉장히 길었습니다. 소스코드를 몇번이고 본문에 넣었더니.. 내용없이 본문 양만 길어진 느낌적인 느낌;;;
어찌됐건 나만의 고유한 Exporter를 만들어냈습니다! 저는 단순히 쿼리를 등록하여 이 결과를 메트릭 결과로 추출해보는 간단한 기능을 구현했지만, 필요에 따라서 더 많은 재미요소를 각자의 생각에 맞게 가미해볼 수 있을 것 같네요.
참고로, 다음 Git에 위에서 작성한 소스는 정리하였습니다.
https://github.com/go-gywn/query-exporter-simple
때로는 하나의 장비에서 수십~수백대의 장비들을 모니터링을 해야할 때.. 중앙에서 메트릭 수집을 관리하는 것이 유용할 때가 있었습니다. 아직은 MySQL만 기능이 제공되지만, 이런 요구사항을 해결하기 위해, 개인적으로 또다른 Query Exporter 프로젝트를 만들어보았습니다. 위 프로제트 베이스에 병렬처리와 타임아웃 같은 기타 등등을 더 구현해보았습니다.
https://github.com/go-gywn/query-exporter
늘 그래왔지만.. 없으면, 만들면 되고.. 있으면 잘 갖다 쓰면 되겠죠? 모든 것을 만들어볼 수는 없을테니. ㅎㅎ
즐거운 한여름 되세요. 🙂